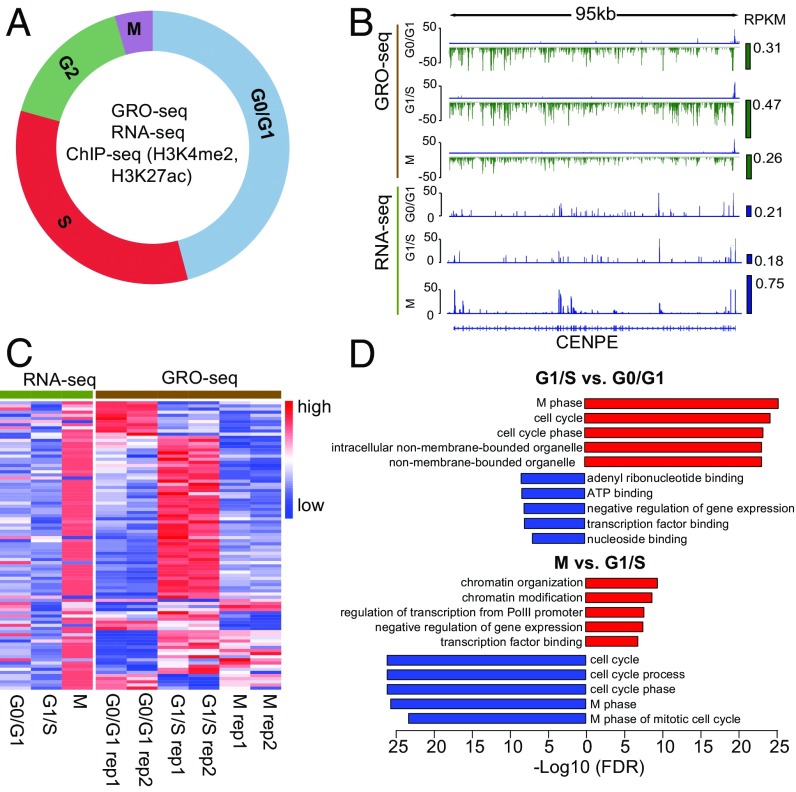
Fig. 1.
GRO-seq and RNA-seq identify different cell-cycle–regulated genes. (A) Illustration of transcriptional dynamics analysis across the cell-cycle stages in MCF-7 cells. GRO-seq and ChIP-seq experiments were performed in two biological replicates, and RNA-seq was performed without replicates. (B) Transcription and expression of CENPE as measured by GRO-seq and RNA-seq at different cell-cycle stages. Green and blue bars on the right side of the signal tracks represent the CENPE transcription and expression levels as measured by reads per kilobase per million mapped reads (RPKM). (C) Transcription (GRO-seq) and expression (RNA-seq) of curated mitotic genes. The genes specifically up-regulated at G2/M were curated from published datasets (Materials and Methods). Read counts of each gene were normalized among the three cell-cycle stages so that their mean equals 0 and the SD equals 1, with red representing higher signal and blue representing lower signal. (D) GO analysis of cell-cycle-stage–specific genes identified by GRO-seq analysis. Bar length represents the −log10 FDR. Red bars indicate terms enriched for up-regulated genes; blue bars indicate terms enriched for down-regulated genes. The top five enriched terms are shown for each comparison.

