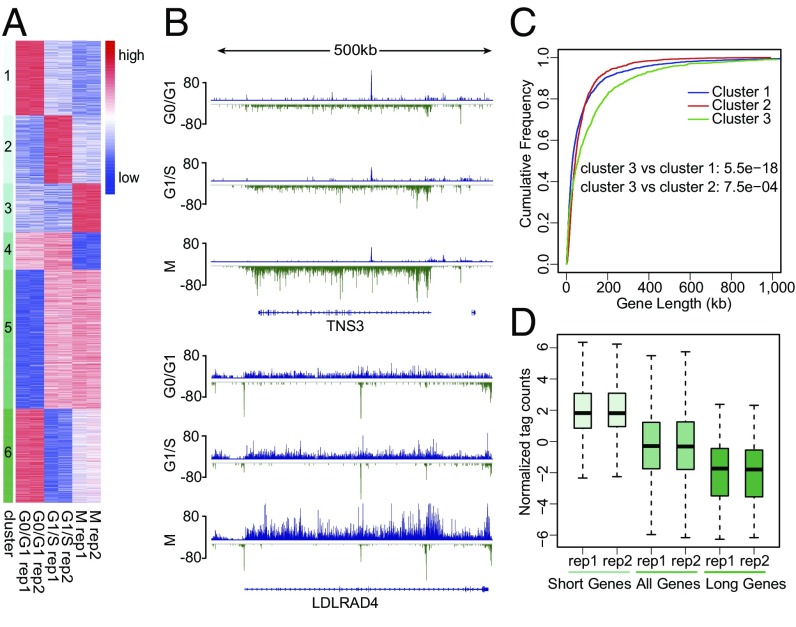
Fig. 2.
Active transcription at early M phase. (A) Clustering of differentially transcribed genes at different cell-cycle stages identified by GRO-seq analysis. Genes are classified into six clusters using unsupervised k-means clustering. (B) Representative long genes up-regulated at M phase. Blue and green bars represent the GRO-seq signal from the plus and minus strands, respectively. Signals were normalized to a total of 10 million reads, and replicates were combined. (C) Empirical cumulative distribution of gene length. Blue, red, and green traces represent the groups of genes with higher GRO-seq signal at G0/G1, G1/S, and M phases, respectively. (D) GRO-seq signal of short (top 25% shortest, two far-left boxes), all (middle two boxes), and long (top 25% longest, two far-right boxes) genes that are highly expressed at M phase (red trace in C).

