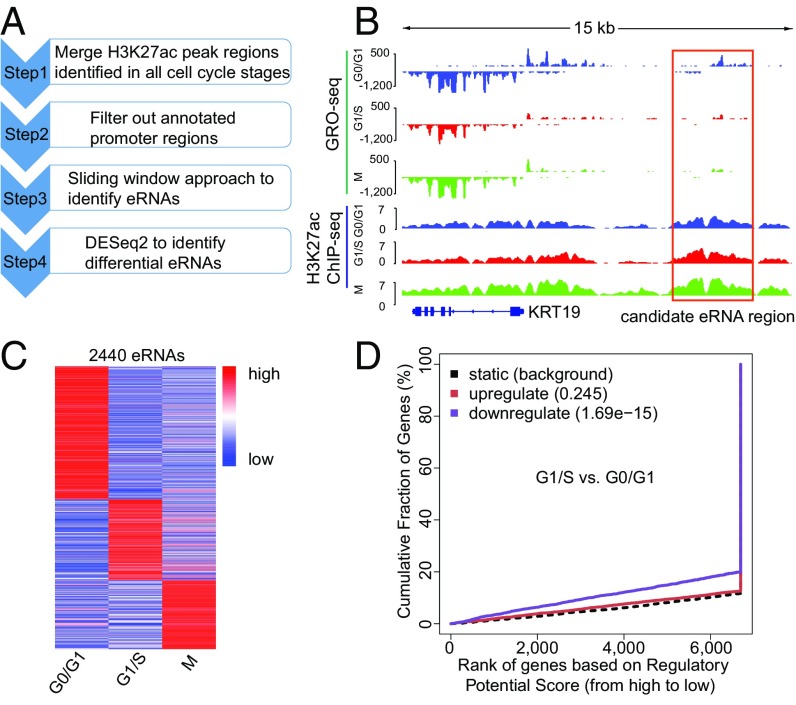
Fig. 4.
Identification of cell-cycle–regulated eRNAs. (A) Workflow for identification of cell-cycle-stage–specific eRNAs. (B) Example of a candidate eRNA near gene KRT19. (C) Heatmap of 2,440 differential eRNAs. Color shows the relative GRO-seq signal at each eRNA region at three different stages. (D) Correlation between cell-cycle–regulated eRNAs and differentially transcribed genes.

