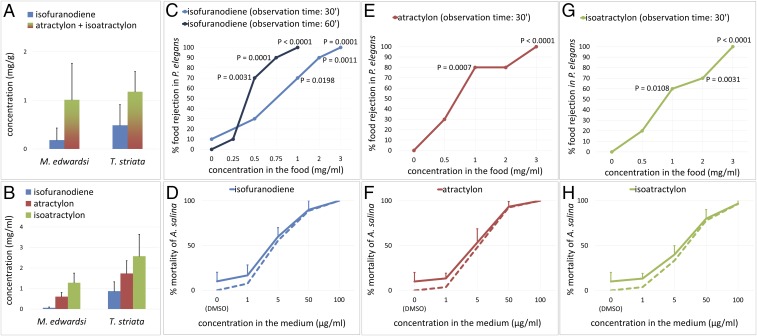
Fig. 3.
Quantification of the metabolites and evaluation of their biological activity. (A and B) Concentration of compounds 1–3 quantified by (A) GC-MS and (B) 1H NMR. Values shown are means and SDs from triplicate extractions from different colonies/individuals. (C, E, and G) Feeding deterrence dose–response curves against P. elegans. The significant differences were evaluated using the two-tailed Fisher's exact test (n = 10 for each tested concentration, α = 0.05). (D, F, and H) Dose–response curves of toxicity to A. salina. The results are shown as the means and SDs of triplicate wells. Because deaths also occurred in the control (vehicle DMSO only), percentages of deaths were corrected by using Abbott’s formula (dashed lines).

