Fig. 2.
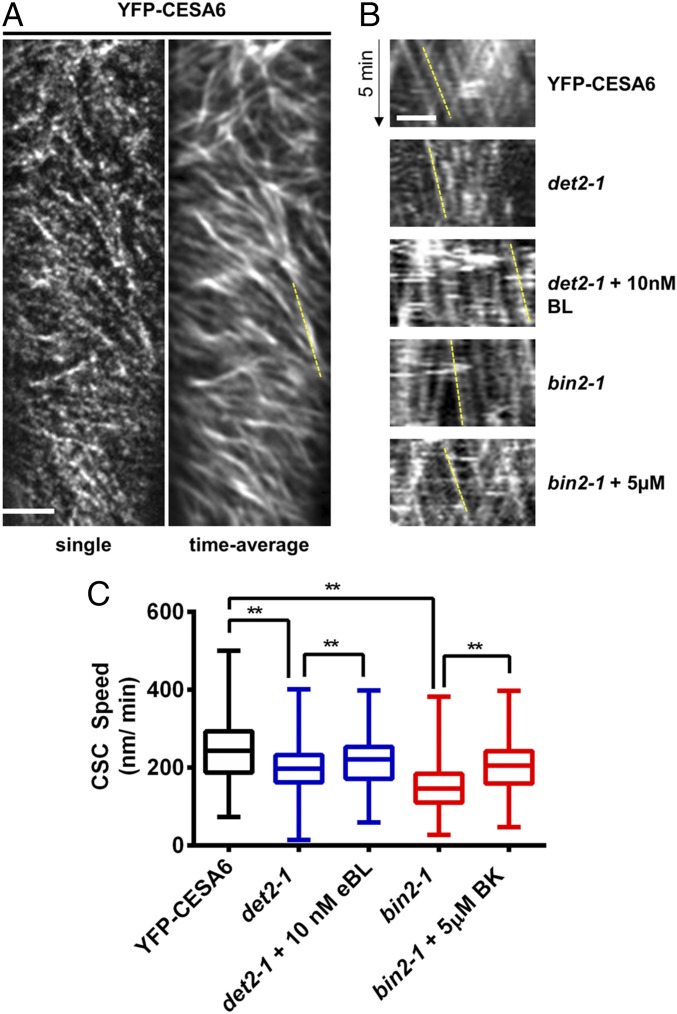
CSC speeds are altered in BR mutants. CSC speeds were examined in 4-d-old dark-grown seedlings by spinning disk microscopy. (A) Single-frame and time-averaged images of YFP-CESA6 control seedlings. (Scale bar: 5 μm.) (B) Kymographs of YFP-CESA6 are shown for the indicated genotype and treatment. The dashed yellow line indicates the slope of a representative YFP-CESA6–containing particle. (Scale bar: 5 μm.) (C) YFP-CESA6 speed distributions of det2-1 plus or minus 10 nM brassinolide (BL; blue boxes) and bin2-1 (red boxes) seedlings plus or minus 5 μM BK are shown compared with YFP-CESA6 control seedlings. Treatments were performed at the indicated concentration for 30 min before imaging. Error bars represent minimum and maximum values (n = 324–1,100 particles). One-way ANOVA indicated a significant difference: F(4, 3,681) = 249.5 (**P < 0.01 by Tukey post hoc analysis between the indicated conditions).

