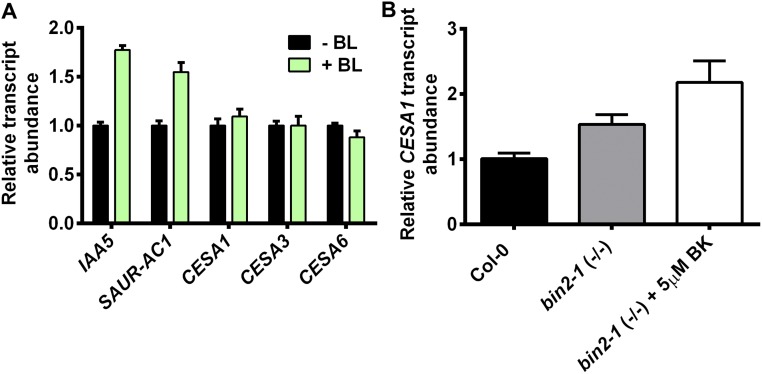
Fig. S1.
Quantification of CESA1 transcript abundance after brassinolide (BL) and bikinin (BK) treatment. (A) Total RNA was extracted from 4-d-old dark-grown seedlings with (green bars) or without (black bars) 30 min of treatment with 10 nM BL. RNA was converted to cDNA as described in SI Materials and Methods, and the transcript levels of CESA1, CESA3, and CESA6 were quantified by quantitative RT-PCR. The BL-induced genes IAA5 (At1g15580) and SAUR-AC1 (At4g38850) were used as positive controls. Error bars represent SEM (n = 3 biological replicates). (B) Total RNA was extracted from 7-d-old dark-grown hypocotyls of wild-type Col-0 (black bar) or homozygous bin2-1 (gray bar) mutant plants either untreated (gray bar) or treated with 5 μM BK for 30 min. RNA was converted to cDNA as described in SI Materials and Methods, and the CESA1 transcript level was determined using quantitative RT-PCR. Error bars represent SEM (n = 4).

