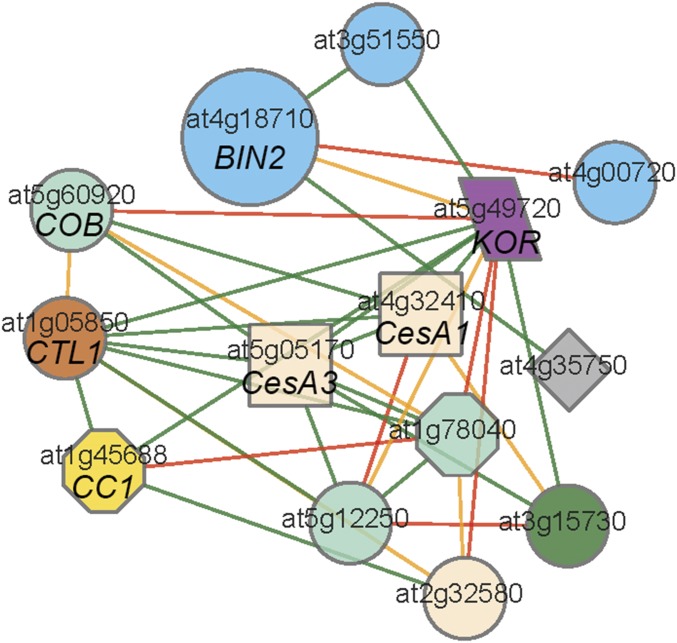
Fig. S2.
Transcriptional coexpression network of BIN2 and primary cell wall CESAs. A coexpression network of primary wall CESAs and BIN2 (At4g18710) is shown. Nodes represent genes, and edges represent coexpression relationships. Different node shapes and colors and different edge colors, respectively, are explained at PlaNet (aranet.mpimp-golm.mpg.de/) and FamNet (www.gene2function.de/famnet.html).

