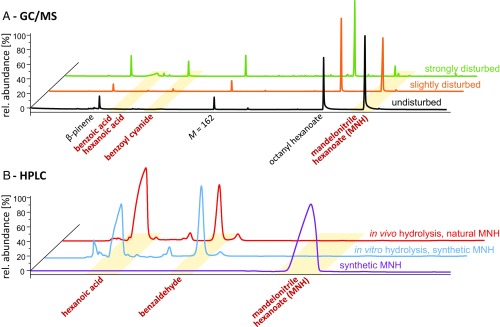
Fig. 1.
GC/MS (A) chromatograms of oil gland secretions of Oribatula tibialis and HPLC (B) chromatograms of mandelonitrile hexanoate (MNH) hydrolysis. (A) Black: profile of secretions from undisturbed mites; orange: profile of slightly disturbed mites (brush stimulus); green: profile of strongly disturbed mites (vortex mixer). (B) Lilac: synthetic MNH; blue: in vitro hydrolysis of synthetic MNH; red: in vivo hydrolysis of natural MNH. Yellow bands highlight compounds involved in cyanogenesis.

