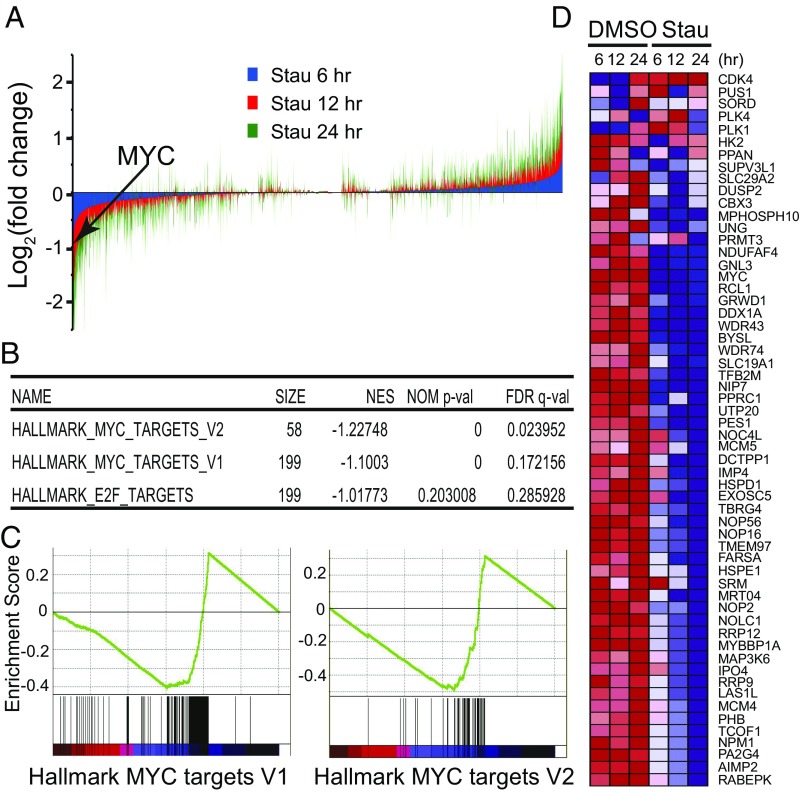
Fig. 3.
Stauprimide selectively suppresses MYC target gene transcription. (A) Genome-wide gene expression analysis by mRNA-seq upon stauprimide treatment (5 μM) in RXF 393 cells at 6, 12, and 24 h time points. The expression levels of each gene were normalized to the total mRNA abundance of each sample and compared with that of DMSO-treated controls. (B) The list of the top gene sets that are enriched over the time course of stauprimide treatment. GSEA analysis was performed using HALLMARK gene set database. (C) Enrichment plot of genes in HALLMARK_MYC_TARGETS_V1 and HALLMARK-MYC_TARGETS_V2 gene sets during the time course of stauprimide treatment. (D) Heat map of the mRNA levels of the genes listed in the HALLMARK_MYC_TARGETS_V2 gene set during the time course of stauprimide treatment.

