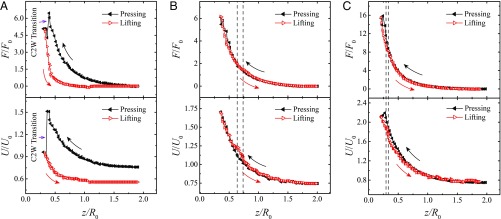
Fig. 3.
Force and energy for the three experiments reported in Fig. 2. The force F exerted by the liquid on its substrate is measured with a force sensor and it is plotted as a function of the gap z normalized by the drop radius R0. The interfacial energy U of the deformed drop is deduced from image analysis and it is also plotted as a function of z/R0. Force and energy are normalized by 2πR0γ and 4πR02γ, respectively. Data are full and black in the pressing stage, and empty and red in the lifting stage. (A) Force and energy for water on OTS-coated pillars, corresponding to the experiments in Fig. 2 A and B. (B) Force and energy for mercury on OTS-coated pillars (experiments in Fig. 2 C and D). Vertical dashed lines mark the boundaries of the mixed WC state observed during the W2C transition. (C) Force and energy for water on Glaco-coated pillars (experiments in Fig. 2 E and F).

