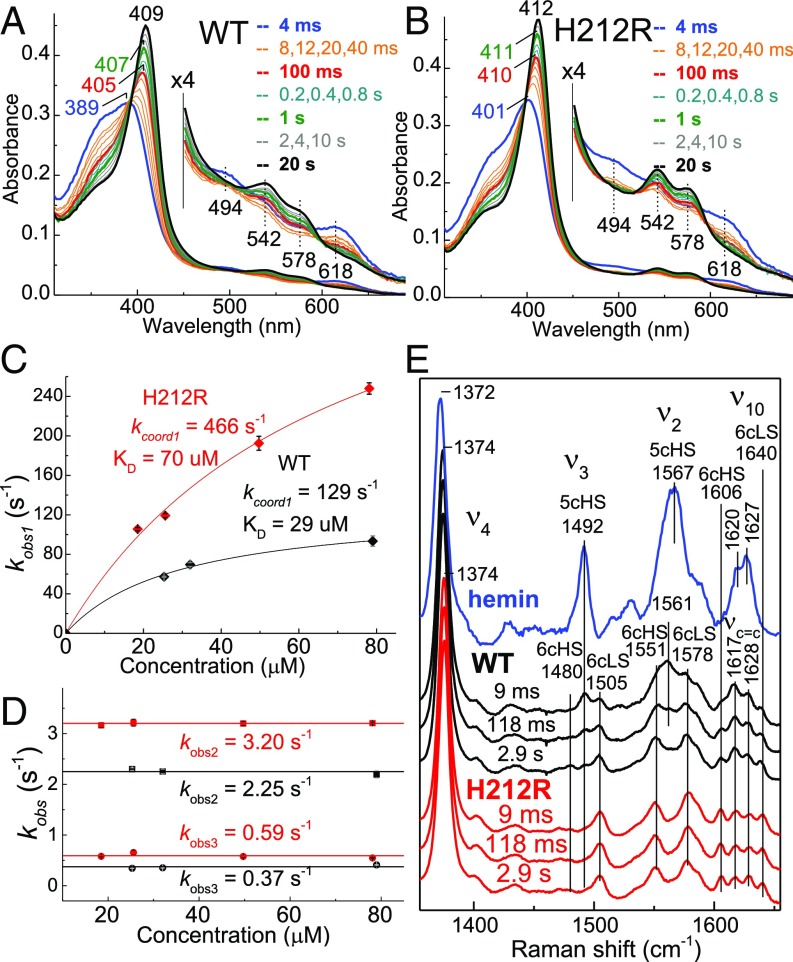
Fig. 4.
Stopped flow absorption and RFQ-RR analysis of hemin binding to WT and H212R apo-PhuS. Stopped flow absorption spectra of the association of 3.5 μM hemin with ∼25 μM (A) WT or (B) H212R apo-PhuS at 4 °C. (C and D) Plots of observed rate constants vs. apoprotein concentrations. (E) RR spectra of RFQ samples of the reaction of 1 eq hemin with ∼150 μM WT (black), ∼150 μM apo-PhuS (red), and buffer control (blue).

