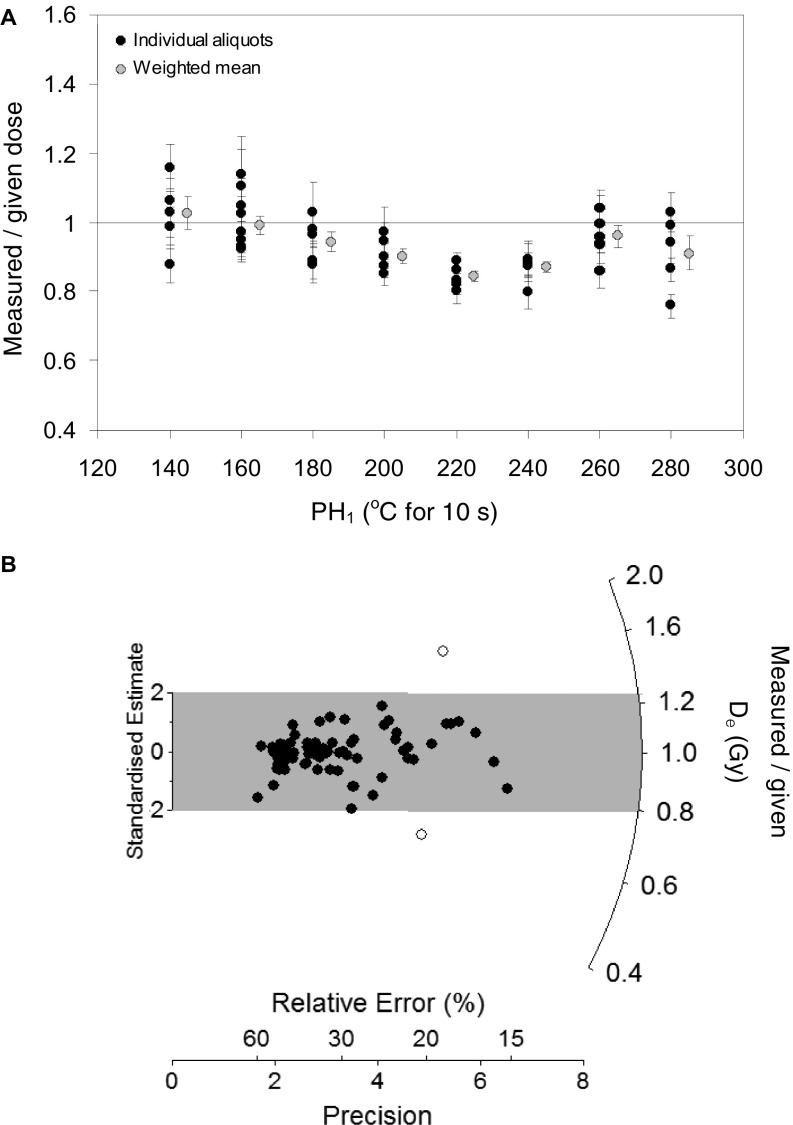
Fig. S2.
OSL dose-recovery test results for sample CRH 11-1. (A) Ratios of recovered-to-given dose versus PH1 temperature (held for 10 s) for ∼400-grain aliquots. The natural OSL signals of the multigrain aliquots were optically bleached with two 1-ks blue LED illuminations at ambient temperature, each separated by a 10-ks pause. A known dose of 100 Gy was then administered to each aliquot and the SAR procedure detailed in table S2 of Arnold et al. (41) was subsequently used to estimate this dose. A fixed PH2 of 160 °C for 10 s was applied in the SAR procedure. (B) Radial plot showing ratios of recovered-to-given dose obtained for individual quartz grains using a PH1 of 160 °C for 10 s and a PH2 of 160 °C for 10 s. The single-grain natural OSL signals were bleached using the same procedure outlined above and the administered doses were subsequently recovered using the single-grain SAR procedure shown in Table S1. The gray shaded region on the radial plot is centered on the administered dose for each grain (sample average = 315 Gy; although this amount varied from 265 to 353 Gy for individual grains, because of spatial variations in the dose rate of the β source). Individual De values that fall within the shaded region are consistent with the administered dose at 2σ.

