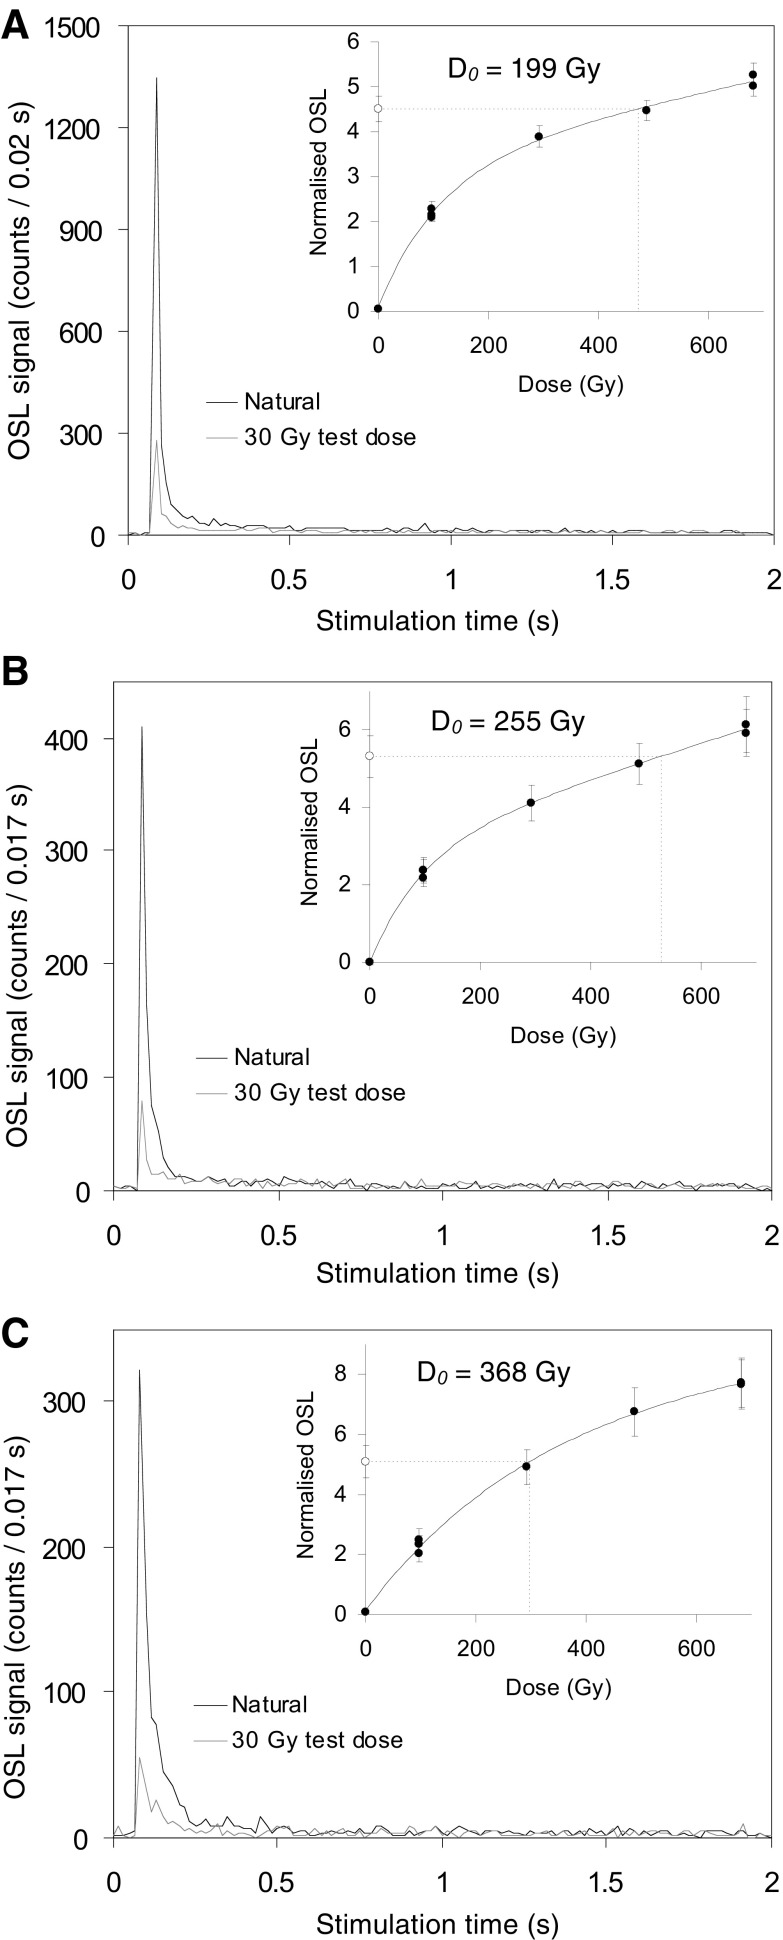
Fig. S3.
Representative OSL decay and dose–response curves for individual quartz grains from the CRH 11 samples. Sensitivity-corrected dose–response curves were constructed using the first 0.17 s of each green laser stimulation after subtracting a mean background count obtained from the last 0.25 s of the OSL signal. (A) Quartz grain from CRH 11-2 with a relatively bright OSL signal (Tn >500 counts/0.17 s). (B) Quartz grain from sample CRH 11-3 with an average OSL signal (Tn = ∼200–300 counts/0.17 s). (C) Quartz grain from CRH 11-2 with a particularly high characteristic saturation dose (D0) value of >350 Gy. In the inset plots, the open circles on the y axis denote the sensitivity-corrected natural OSL signals, and the sensitivity-corrected regenerated OSL signals are shown as filled circles.

