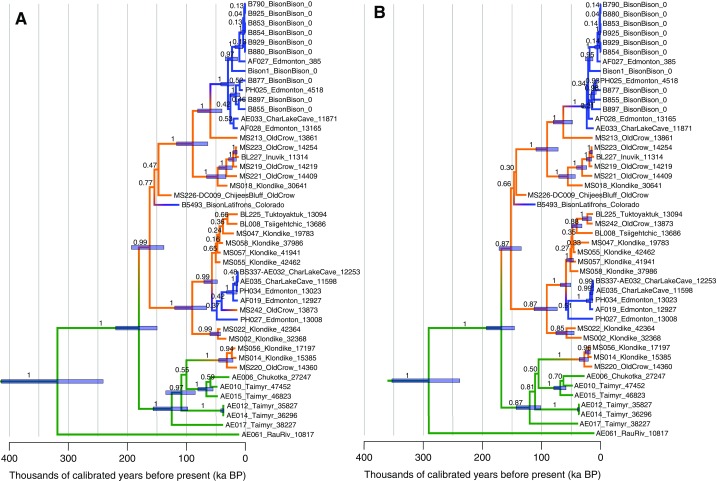
Fig. S5.
Maximum clade credibility trees resulting from the Bayesian analysis of the reduced (A) and full (B) mitochondrial genome data sets. The reduced dataset (A) is also depicted in Fig. 1E. Colors are as in Fig. 1. Numbers along the branches are Bayesian posterior probability scores for each clade. Bars represent 95% highest posterior probability density intervals for node heights and are reported for nodes with a posterior probability score of >0.95 (A) or >0.85 (B). Tip labels follow the convention of sampleID_locality/species_age as in Dataset S1.

