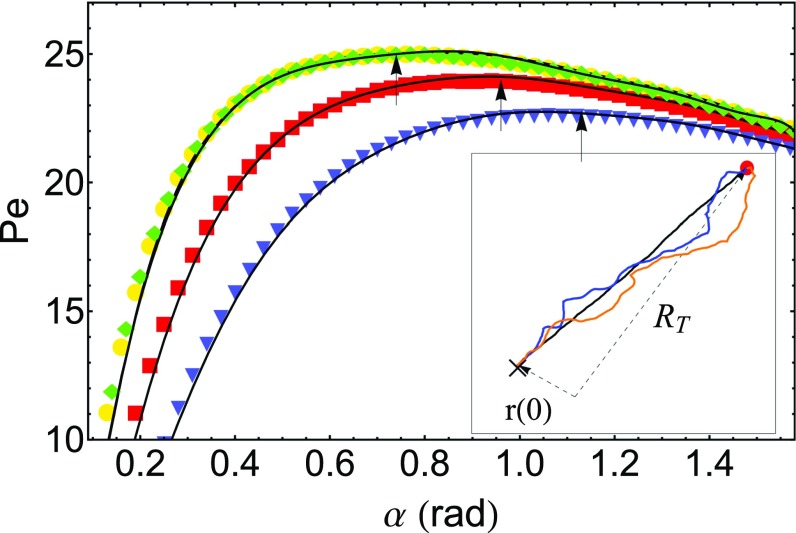
Fig. 6.
Evolution of the Péclet number with respect to obtained numerically for a target at distance and . Yellow shows and . Red shows and . Blue shows and . Green shows and . for all of the results shown here. The black curves correspond to the theoretical predictions given by Eq. 20, and the arrows indicate the maximum Péclet number. (Inset) Examples of numerical trajectories of a particle under feedback control for several values of tolerance angle: (black), (blue), and (orange). The red circle corresponds to the position of the target.

