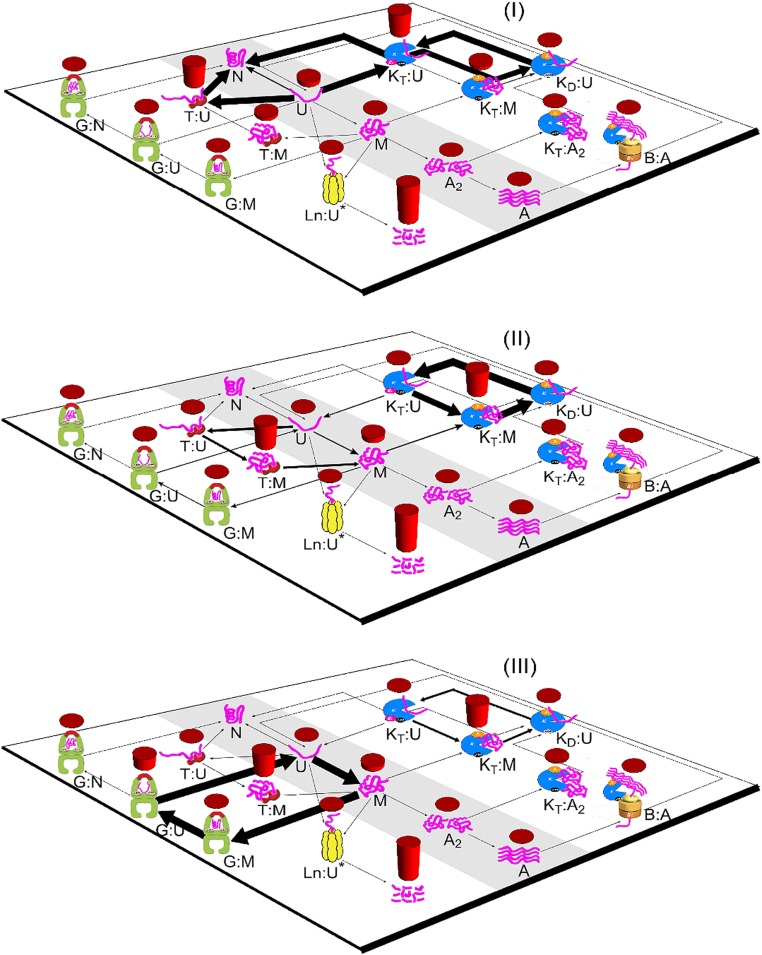
Fig. 2.
The dynamical sorting of three classes of proteins through the different chaperone systems. Predicted concentrations of species are shown by red bar heights, and fluxes between species are shown by the thicknesses of arrows. Growth rate corresponds to a 40-min cell-doubling time. A, aggregate; G, GroEL; K, DnaK.

