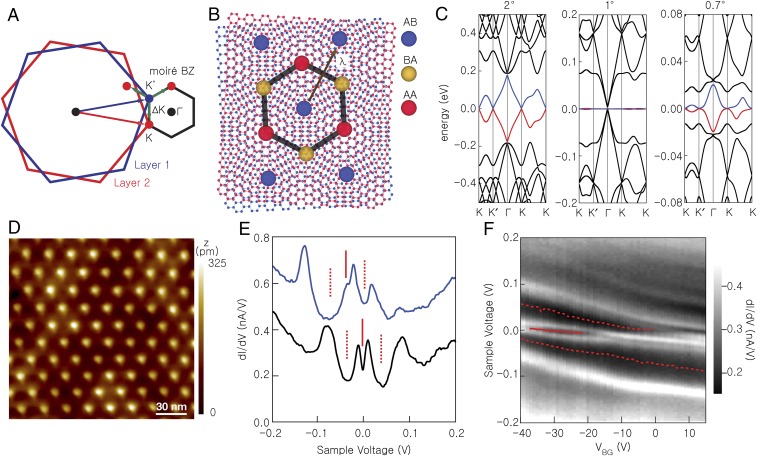
Fig. 2.
SPM mapping of the moiré pattern in an STA bilayer graphene, and DOS. (A) The first BZ of each graphene layer, and of the moiré pattern. (B) Illustration of the local stacking in twisted bilayer graphene. (C) Moiré bands of twisted bilayer graphene. For twist angles θ larger than 2° most states are strongly localized in one layer, linear band crossings (Dirac points) occur at the moiré BZ corners (K, K′) with velocities that are slightly suppressed relative to those of the isolated graphene, a van Hove singularity occurs at the midpoint of K and K′, and a small gap opens at the center of the moiré BZ (Γ), at the extrema of the first moiré conduction and valence bands. For θ ∼ 1° the first moiré bands are extremely narrow. For smaller twist angles, a second conduction and valence band are present at energies below the Γ-centered gaps. The lowest-energy bands above and below charge neutrality are shown in blue and red, respectively. (D) SPM topography image showing a λ = 20.1 nm moiré pattern. The sample voltage is 0.3 V and the tunnel current is 100 pA. (E) TDOS at two different back-gate voltages, −31 V (black) and +2 V (blue). The features corresponding to the charge neutrality point and the secondary dips in the TDOS curves are marked by solid and dashed lines, respectively. The traces are offset for clarity. (F) TDOS as a function of sample voltage and back-gate voltage. The solid and dashed lines trace the movement of the charge neutrality point and the secondary dip in the TDOS. The data of D–F were collected at T = 4.5 K.

