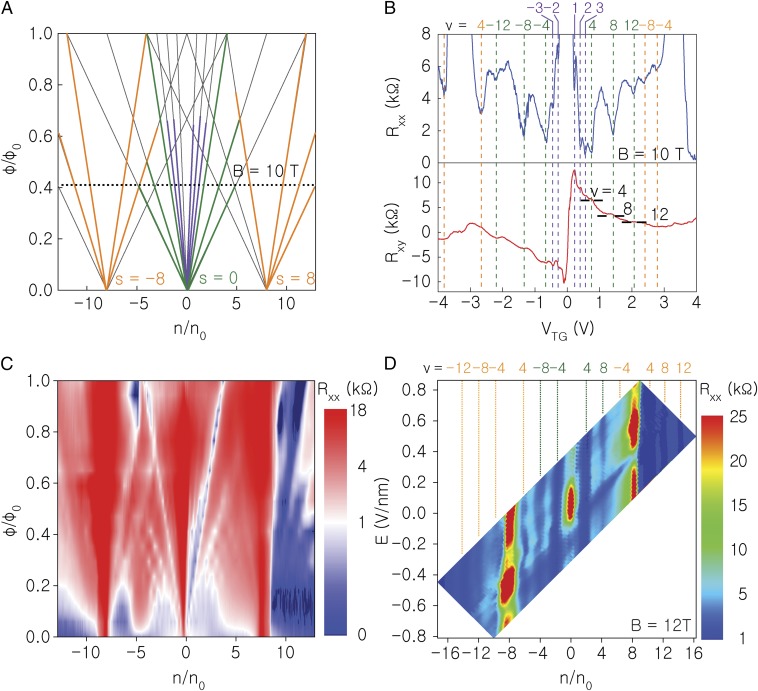
Fig. 4.
Magnetotransport properties of STA bilayer graphene. (A) LL fan diagram constructed using the Diophantine equation 1. The green (orange) lines represent QHSs observed experimentally in C at ν = ±4, 8, 12 and s = 0 (s = ± 8). The purple lines represent broken-symmetry QHSs at ν = ±1, 2, 3 and s = 0 corresponding to C data. (B) Rxx (Top) and Rxy (Bottom) vs. VTG measured at B = 10 T, and T = 1.5 K in an STA bilayer graphene with θ = 0.97°. The ν-values are marked for each QHS. The QHSs with ν = ±4, 8, 12 and s = 0 (s = ±8) are marked in green (orange). The QHSs with ν = ±1, 2, 3 are marked in purple. (C) Contour plot of Rxx as a function of ϕ/ϕ0 and n/n0 in the same sample. The ϕ/ϕ0 = 1 value corresponds to B = 24.5 T. The data are measured at T = 1.5 K up to B = 14 T, and at T = 5 K for B fields larger than 15 T. (D) Contour plot of Rxx vs. n/n0 and E field, at B = 12 T, and T = 1.5 K. The ν-values are marked for each QHS. The QHSs with ν = ±4, 8, 12 and s = 0 (s = ±8) are marked in green (orange). Several transitions are observed as a function of the transverse E field, with Rxx at (ν, s) = (0, 0) decreasing with the applied E field.

