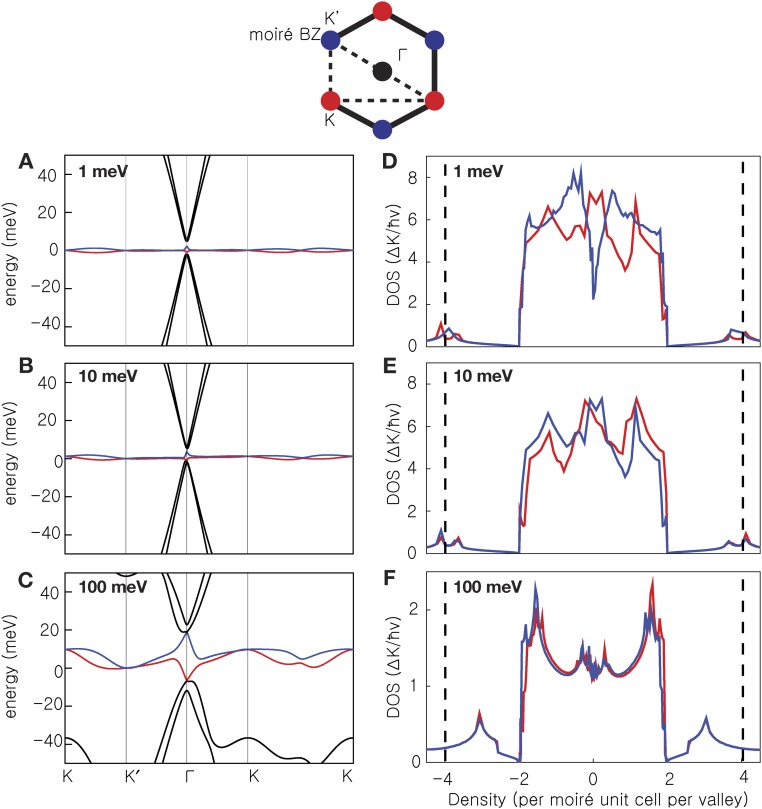
Fig. S2.
Band structure (A–C) and DOS (D–F) for twisted bilayer graphene with an on-site energy difference between the top and bottom layers, respectively. Calculations are performed with the following + (−) on-site energy for the top (bottom) layer: 1 meV (A and D), 10 meV (B and E), and 100 meV (C and F). The opposite energies on each layer break the layer symmetry, and lead to a valley-dependent DOS, represented by blue and red lines on the DOS plots. The low-energy bands touch at K and K′ points, associated with the Dirac points in each of the two layers, but their energies are shifted relative to one another. As a result, there is no longer a zero DOS at charge neutrality. However, there is still a minimum in the DOS at 4 particles per moiré unit cell (2 particles per moiré unit cell in each valley) due to the filling of 1 band per spin and valley (the densities of the two valley-dependent DOS curves must be added to get the total DOS). The dashed vertical lines in DOS plots mark the minima observed experimentally.

