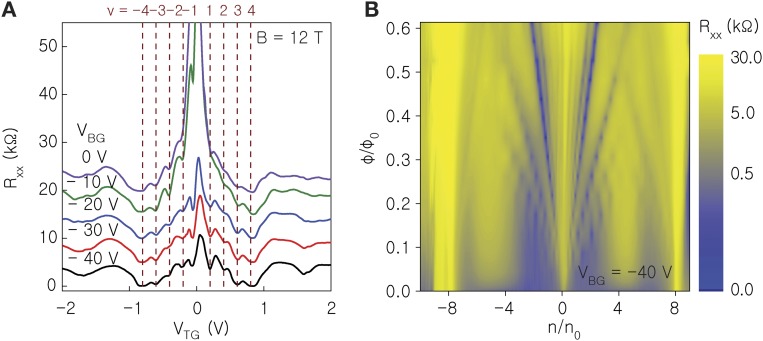
Fig. S3.
Broken-symmetry QHSs of STA bilayer graphene at ν = ±1, 2, 3. This figure is an example of developing broken symmetry ν = ±1, 2, 3 QHSs in an STA bilayer graphene sample with θ = 0.97°, which signals a lifting of the spin and valley degeneracy in the lowest LL. (A) Rxx vs. VTG measured in STA bilayer graphene at B = 12 T, and T = 1.5 K, at different VBG from –40 to 0 V. The Rxx vs. VTG traces are shifted horizontally to align the charge neutrality points at VTG = 0 V. The ν = ±1, 2, 3, 4 QHSs are marked with dashed lines. (B) Contour plot of Rxx as a function of ϕ/ϕ0 and n/n0 at VBG = −40 V, revealing a Hofstadter butterfly with subband indices s = ±8, and broken-symmetry QHSs at ν = ±1, 2, 3.

