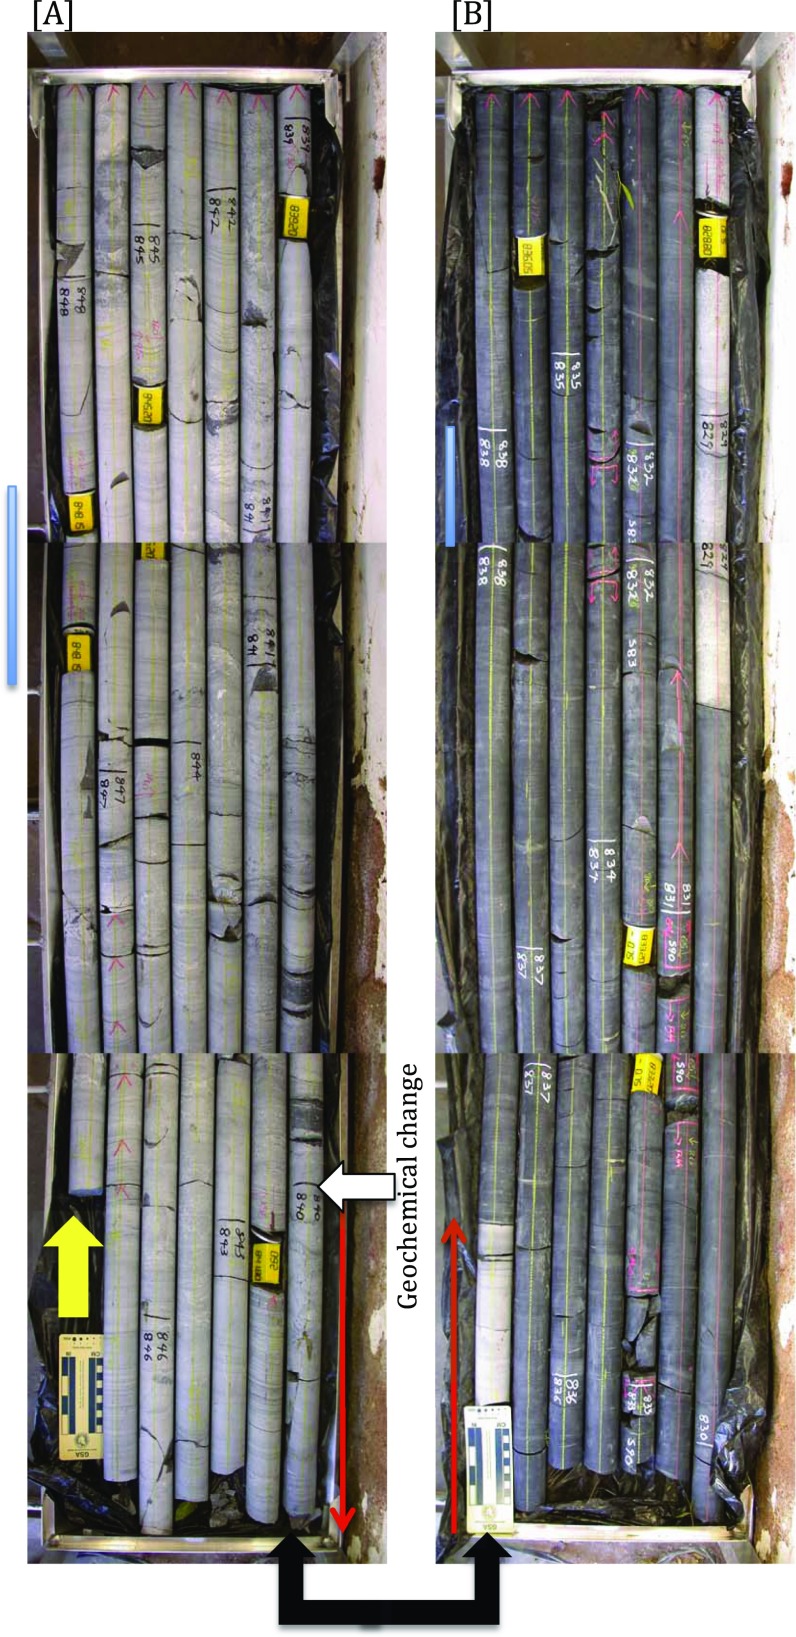
Fig. S3.
Initial core photographs corresponding to the onset of the C-S anomaly. The cores become progressively younger up the page, as signaled by the bold yellow arrow and initial core markings. The older (deeper) core tray (A) is joined to the younger (shallower) tray B by the bold black arrows. The onset of the C-S anomaly (in both Δ36S/Δ33S and δ13C) is seen by 840-m core depth (annotated), whereas the change in lithology (from calcareous mudstone to mudstone) occurs at least 1 m up-core, in younger rocks. Thin red arrows highlight this nontrivial stratigraphic difference. Core photographs and detailed lithological logs of cores GKF01 and GKP01 are available via the Agouron-Griqualand Paleoproterozoic drilling project online database (general.uj.ac.za/agouron/index.aspx). These photos feature overlap (core markings and vertical blue boxes), and hence repetition of strata, to ensure the entire core was imaged.

