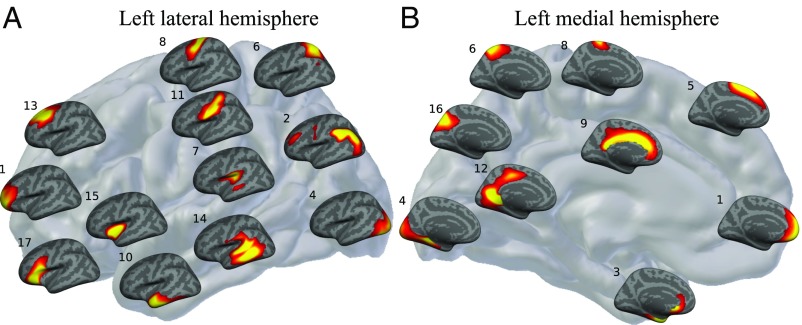
Fig. 2.
A grid placement of the 18-PSC solution on the lateral (A) and medial (B) aspect of the left cortical hemisphere (for the right cortical hemisphere, see SI Appendix, Fig. S7). The location of each PSC on the gray brain map represents the location each component best encodes. Warmer colors correspond to higher values. In describing the estimated PSCs, we use conventional anatomical labels, but these only approximate the observed patterns: 1, prefrontal cortex (PFC); 2, inferior lateral parietal cortex; 3, entorhinal cortex and medial temporal pole; 4, occipital cortex; 5, superior frontal cortex; 6, superior parietal cortex; 7, perisylvian region; 8, primary motor cortex; 9, cingulate; 10, inferior and anterior middle temporal lobe; 11, primary somatosensory cortex; 12, lingual gyrus; 13, dorsolateral frontal cortex; 14, left posterior middle and superior temporal lobe; 15, insula; 16, precuneus; 17, inferior frontal cortex; and 18, pars opercularis and triangularis predominantly present in the right hemisphere (not shown here; SI Appendix, Fig. S7).

