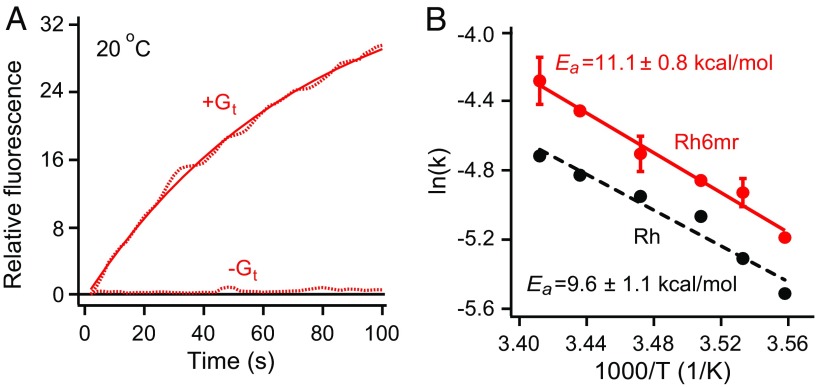
Fig. 1.
Gt activation kinetics of Rh6mr. (A) The Gt activation ability of Rh6mr was monitored by an increase in the intrinsic tryptophan fluorescence of the Gt alpha subunit in the presence of light-activated Rh6mr at 20 °C (pH 7.0). (B) Arrhenius plot for Rh6mr Gt activation for a temperature range of 8 to 20 °C. Natural logarithms of the measured Gt activation rate constants were plotted against inverse temperatures. The slopes of Arrhenius lines (Rh6mr, solid red; Rh, black dashes) provide the energy required for the Rh6mr conformational change needed for Gt activation (Ea).

