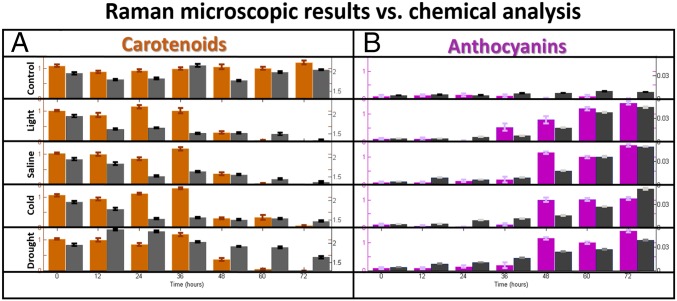
Fig. 4.
(A) The bar distributions for the fit coefficients for carotenoids (brown) and the chemically extracted values for carotenoids (milligrams per gram dry weight; gray) as functions of durations of the abiotic stresses. (B) The bar distributions for the fit coefficients for anthocyanins (violet) and the chemically extracted values for anthocyanins (micrograms per microliter dry weight; black) as functions of durations of the abiotic stresses.

