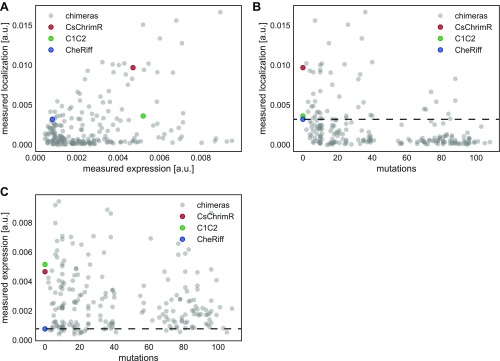
Fig. S2.
Interdependencies of chimera properties. Chimera data are plotted as gray points, and parental data points are highlighted in color (red, CsChrimR; green, C1C2; and blue, CheRiff). (A) Plot of measured localization [mean GFP fluorescence (in arbitrary units)] vs. measured expression [mean mKate fluorescence (in arbitrary units)] shows no clear correlation. (B) Plot of measured localization vs. number of mutations from closest parent. (C) Plot of measured expression vs. number of mutations from closest parent. Dashed lines in B and C show the measured properties of the lowest-performing parent (CheRiff).

