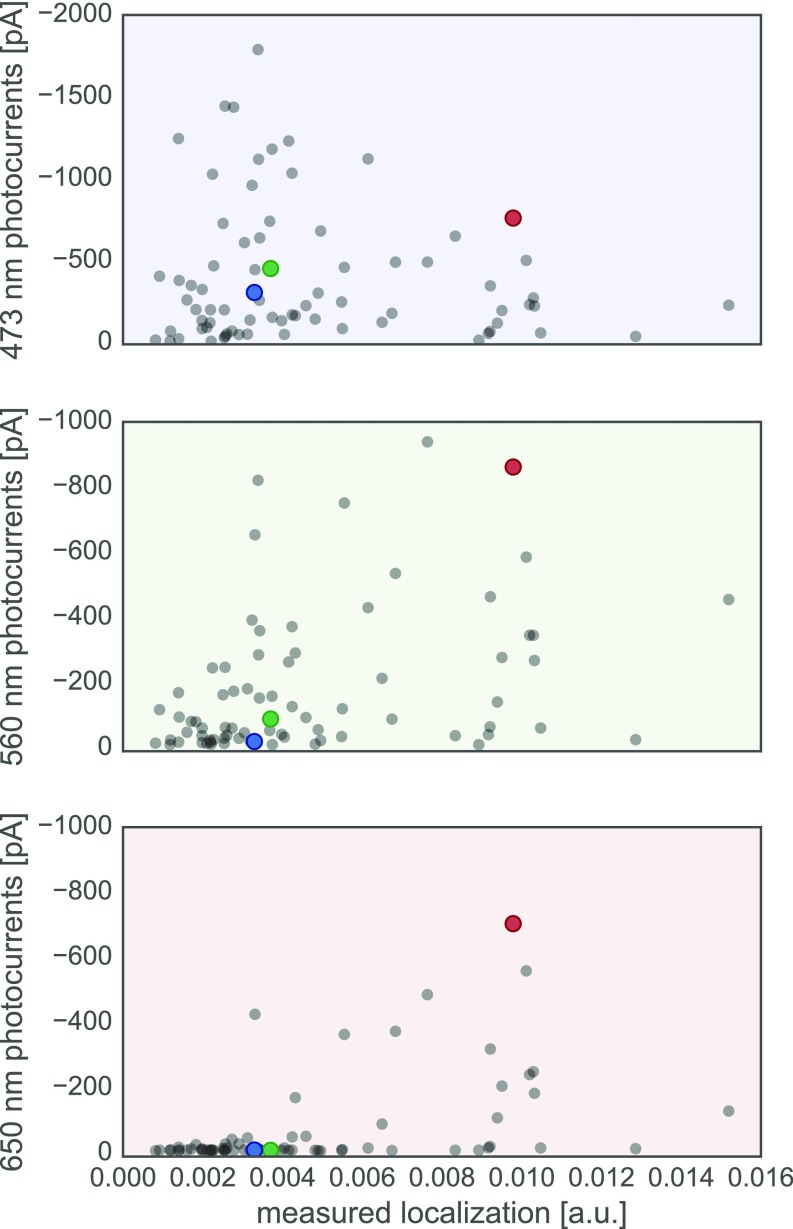
Fig. S6.
Photocurrents vs. measured localization for all tested chimeras. Chimera data are plotted as gray points and parental data points are highlighted in color (red, CsChrimR; green, C1C2; and blue, CheRiff). Plot of measured photocurrents vs. measured localization [mean GFP fluorescence (in arbitrary units)] for three different wavelengths: 473 nm (Top, blue shading), 560 nm (Middle, green shading), and 650 nm (Bottom, red shading).

