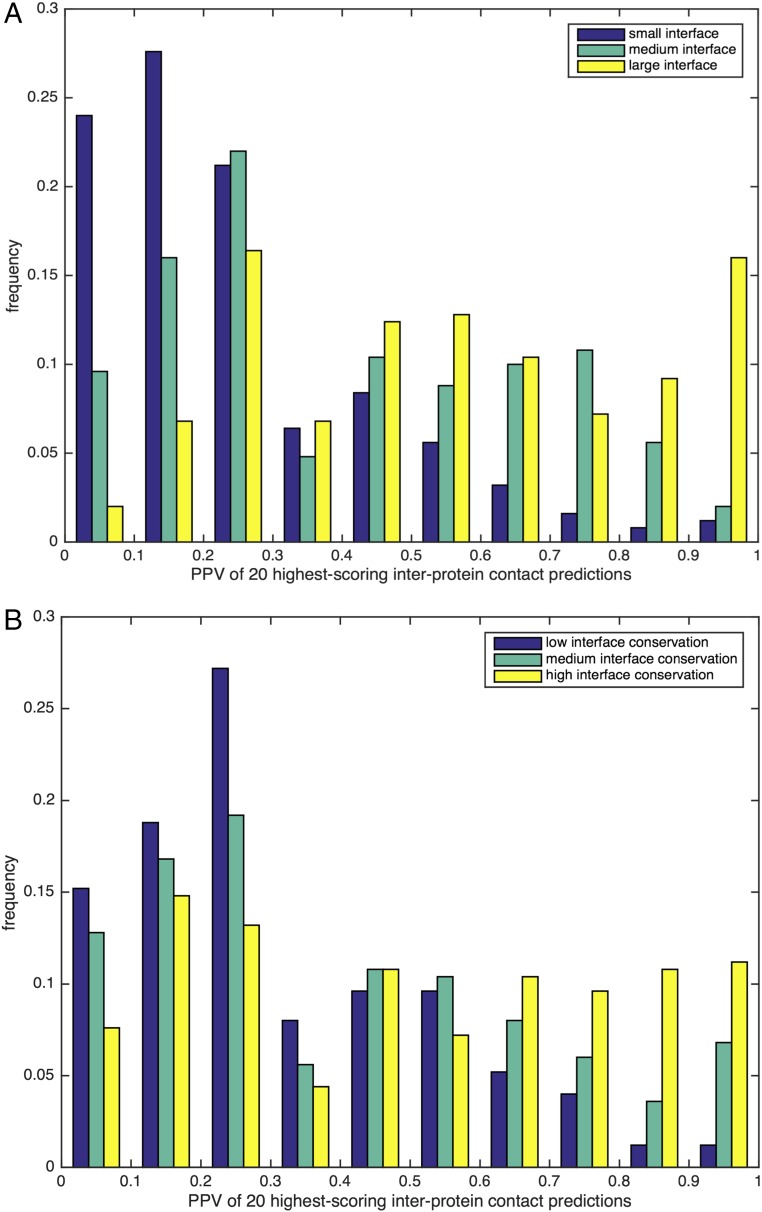
Fig. 4.
Influence of interface size and conservation on the accuracy of interprotein contact prediction. (A) Histogram for the PPV [PPV = TP/(TP + FP)] of the first 20 contact predictions for the 750 selected oligomer-forming protein families. For the histogram, the dataset is divided into three classes according to their interface size (small, medium, and large), measured by the number of interprotein contacts. Whereas families with a large interface size dominate the highest accuracy cases, families with a small interface size typically lead to very bad PPVs. (B) Analogous histogram, now with the dataset of selected families with at least two alternative homo-oligomeric structures. More conserved interfaces (i.e., with less variability between the different representative structures of the concerned family) frequently show higher PPV values than variable interfaces. Because the coevolutionary signal for each oligomerization mode is specific to an appropriate selection of proteins, it becomes weak in the overall family alignment, which mixes different oligomerization modes.

