Fig. 1.
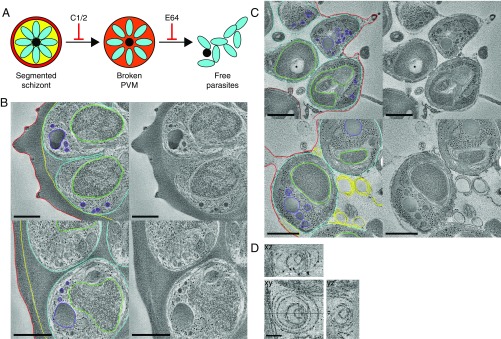
Tomography of C1 and E64 stalled schizonts reveals the fate of the PVM at different stages in egress. (A) Schematic indicating the steps at which egress is stalled by the inhibitors C1/C2 and E64. (B) Life cycle stage-specific equalization of vacuole and erythrocyte contents in C1-treated schizonts. Tomogram slices from freeze-substituted sections of a partially segmented schizont showing a contrast difference across the PVM (Top) and a fully segmented schizont with an equalization of contrast across the PVM (Bottom). Each image is the average of 10 central slices from a tomogram and is shown with and without outlining of key features. Red, blood cell membrane; yellow, PVM; cyan, merozoite plasma membrane; green, merozoite nuclei; purple, apical organelles. (Scale bar, 500 nm.) (C) Slices from tomograms of freeze-substituted sections of schizonts arrested by E64. Each slice is shown with and without outlining of key features. Brown, digestive vacuole; other colors as above. In Top, an asterisk marks a knob structure on the erythrocyte membrane. (Scale bar, 500 nm.) (D) Slices in the xy, xz, and yz planes from tomograms of membrane whorls in E64 stalled schizonts, demonstrating that they are spherical multilamellar vesicles. Lines in the xy image show the positions of the other planes. (Scale bar, 100 nm.)

