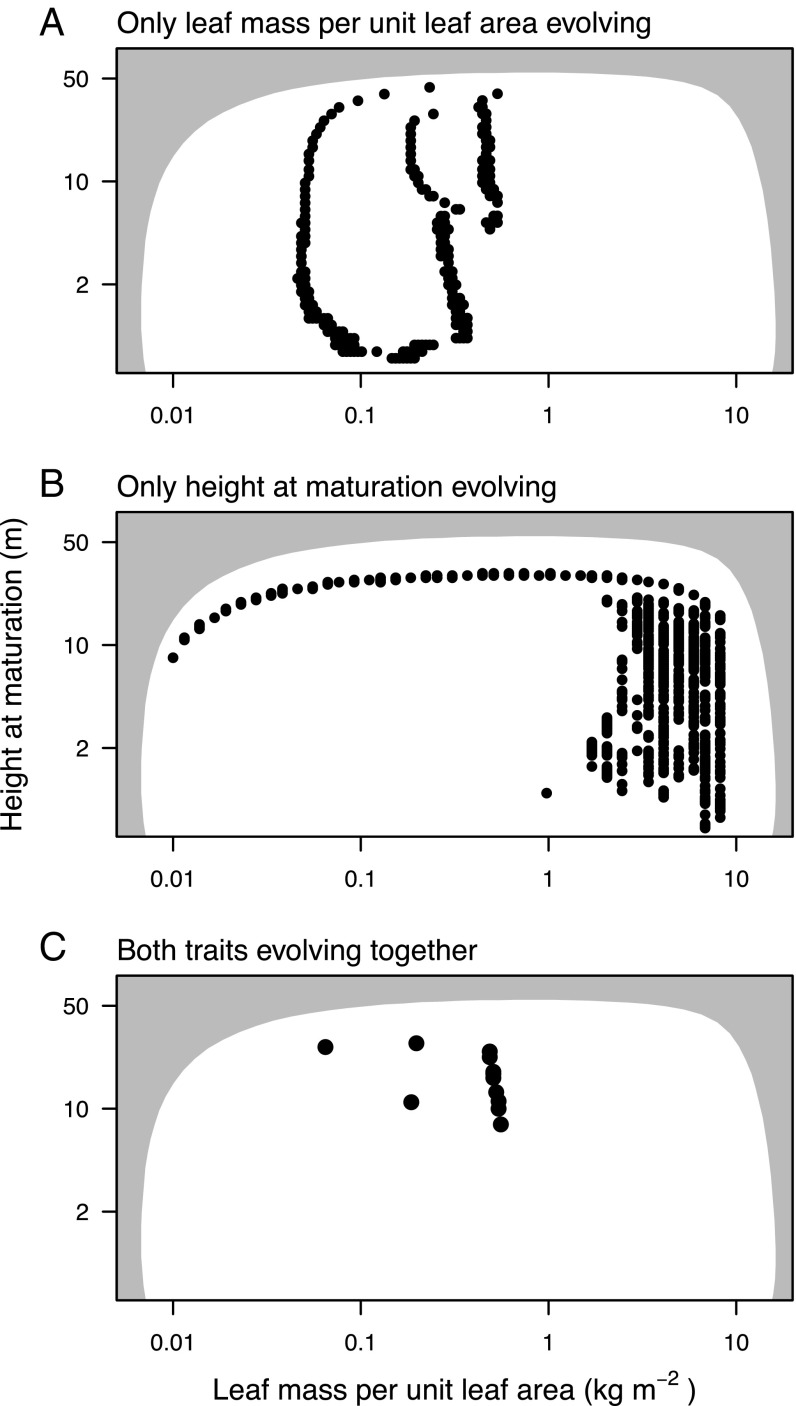
Fig. 4.
Rich interactions between the two functional traits determine the evolution of bivariate trait mixtures. A and B show the evolved univariate mixtures in each trait when the other trait is fixed at a specific value, and C shows the bivariate trait mixture that results when both traits are evolving together. Each circle represents a single species. The shaded region is the same in each panel and indicates trait combinations that are not viable even in the absence of any competition (Fig. 3A).

