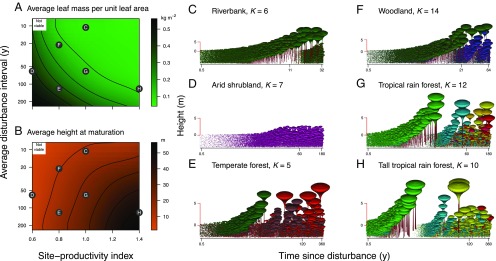
Fig. 5.
Extended niche models allow for natural variation of forest structure and diversity with environmental conditions, recovering widely observed empirical patterns. (A and B) Mean trait values vary across metacommunities evolved for different average disturbance intervals and site productivities. The resultant fitness landscapes are shown in SI Appendix, Fig. S13. Letters refer to the metacommunities illustrated in C–H. (C–H) Resultant successional dynamics in a patch in the wake of a disturbance. The center tick labels along the logarithmically scaled horizontal axes indicate the average disturbance intervals. Colors indicate trait combinations as in Fig. 1. Panel labels suggest real vegetation types bearing likeness to our model-evolved metacommunities. Also shown is the number of distinct functional types in each metacommunity (determined as the number of trait combinations with positive seed rain differing from one another by at least 1% in each functional trait after 5,000 steps of community assembly).

