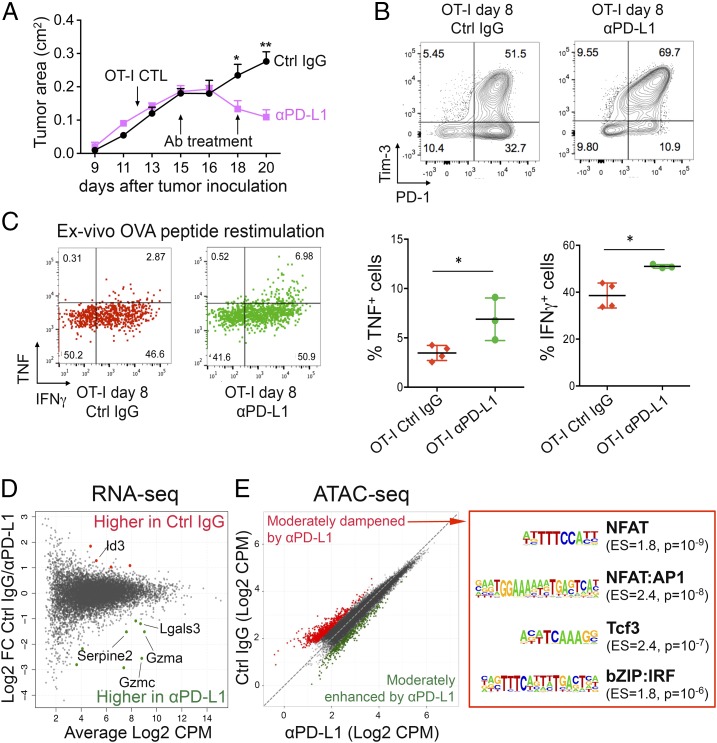
Fig. 6.
Effects of anti–PD-L1 treatment on phenotype and chromatin accessibility of OT-I TILs. Mice bearing s.c. B16-OVA tumors adoptively transferred with 2 × 10⁶ OT-I CTLs on day 12 received two injections of anti–PD-L1 or control IgG as indicated (day 15 and day 18); n = 4–5 mice per group. (A) Tumor growth curves with average ± SEM. (B) Expression of PD-1 and Tim-3 on OT-I TILs 8 days after in vivo transfer; each plot corresponds to a pool of two to four mice. (C, Left) TNF and IFNγ intracellular staining of OT-I TILs from mice treated with control IgG or anti–PD-L1, after restimulation with OVA peptide. (C, Right) Quantification of TNF and IFNγ production; each dot represents a mouse; mean ± SD is shown (*P value <0.05, unpaired t test). (D) MA plot of gene expression changes in OT-I TILs isolated from mice treated with anti–PD-L1 versus Ctrl IgG (n = 2–3). Each dot represents a gene. Dots highlighted in color are significantly different [abs(log2 FC) ≥ 1 and FDR ≤ 0.1] between the two groups. (E, Left) Scatterplot showing the averaged ATAC-seq signal in OT-I TILs 8 days after transfer from mice treated with anti–PD-L1 or control IgG (n = 2–4). Each dot represents a peak. Regions more accessible in anti–PD-L1 than control or vice versa using a relaxed metric (fold changes exceeding 2 SDs from the mean) are highlighted in green and red, respectively. (E, Right) Transcription factor-binding motifs significantly enriched in regions dampened by anti–PD-L1 treatment. Enrichment scores (ES) and P values are shown.

