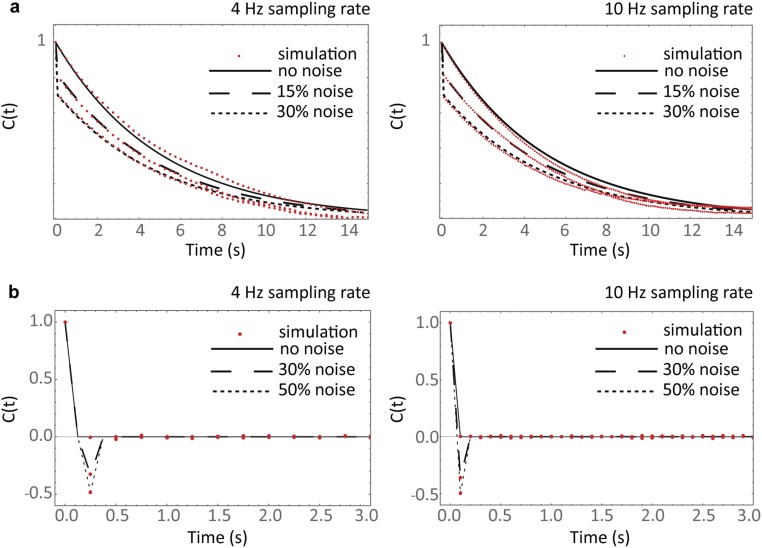
Fig. S1.
Testing the robustness of the analysis to experimental noise and sampling rate. A full stochastic simulation of the cap reaction network was implemented to generate simulated cap and growth fluctuation data. Twenty tracks with an average duration of 200 s were analyzed replicating the experimental data. (A) Autocorrelation functions of simulated cap fluctuations (red) are compared with theory (black lines, Eq. 6) for different noise conditions (modeled as additive white Gaussian noise) at a sampling rate of 4 Hz (Left) and 10 Hz (Right). (B) Autocorrelation functions of simulated growth fluctuations (red) are compared with theory (black lines, Eq. 5) under different experimental noise conditions at a sampling rate of 4 Hz (Left) and 10 Hz (Right). Agreement between theory and experiment supports the validity of the model and robustness of the analysis under relevant experimental conditions.

