
FIGURE 2.
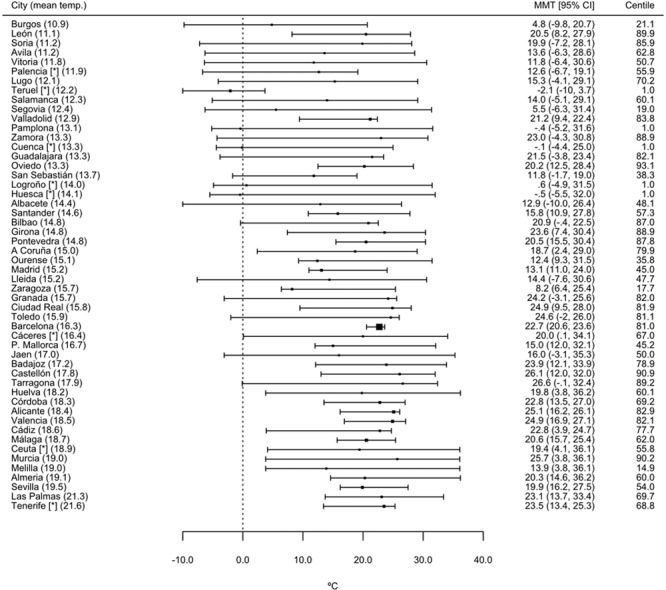
Forest plot for the estimated minimum mortality temperatures, and its corresponding percentile, for the 52 provincial capital cities in Spain. Cities are sorted by annual mean temperature, which is indicated in parentheses after the city name. *Cities with minimum mortality temperature constrained to the 1st–99th centile range of mean temperature. MMT indicates minimum mortality temperature.