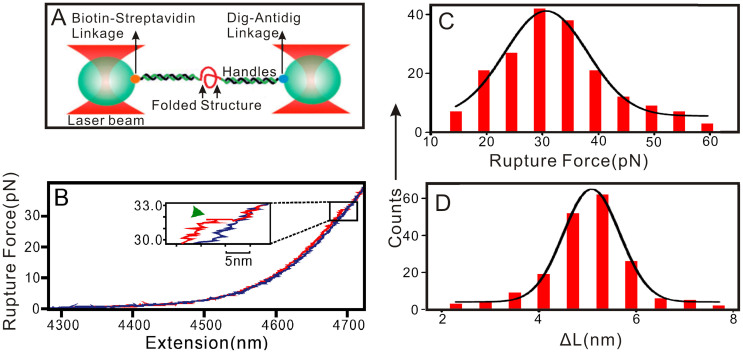
Figure 10. Mechanical unfolding of Hum15 in the presence of 100 mM Ca2+.
(A) Schematic of the single-molecule mechanical unfolding assay (not to scale). (B) A typical force-extension (F-X) curve for Hum15. The red and blue depict the stretching and relaxing Hum15 curves, respectively. The green arrowhead shows the unfolding event. Change in contour length (ΔL) (C) and rupture force (D) histograms for structures in Hum15. The solid curves in (C) and (D) are Gaussian fittings.

