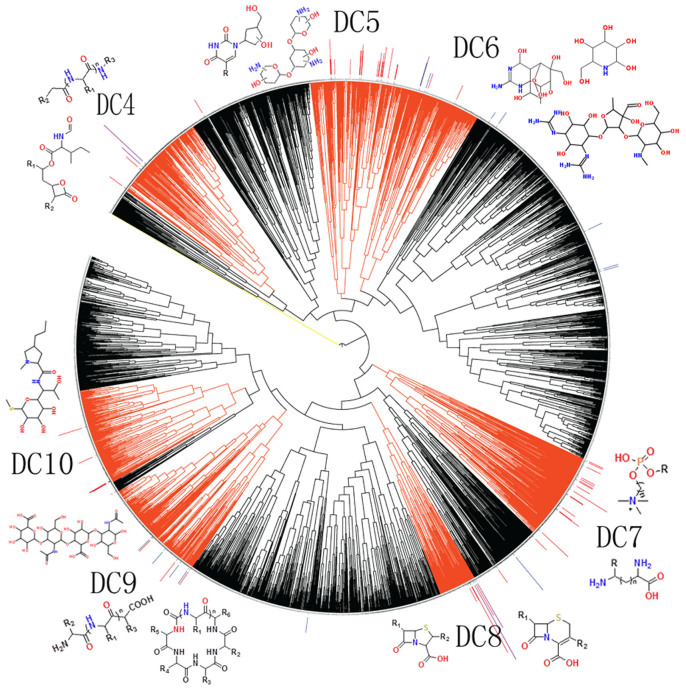
Figure 2. Distribution of the natural product leads of approved and clinical trial drugs in branch 3 of the substructure-fingerprint clustering tree of the 137,836 natural products and 442 natural product leads.
The drug-lead productive clusters are red-orange colored and marked by the respective cluster label DC4-DC10. The red, purple and blue lines on top of the clustering tree indicate the locations of the approved, approved + clinical trial, and clinical trial drug-leads with the height correlating with the number of approved + clinical trial drugs.

