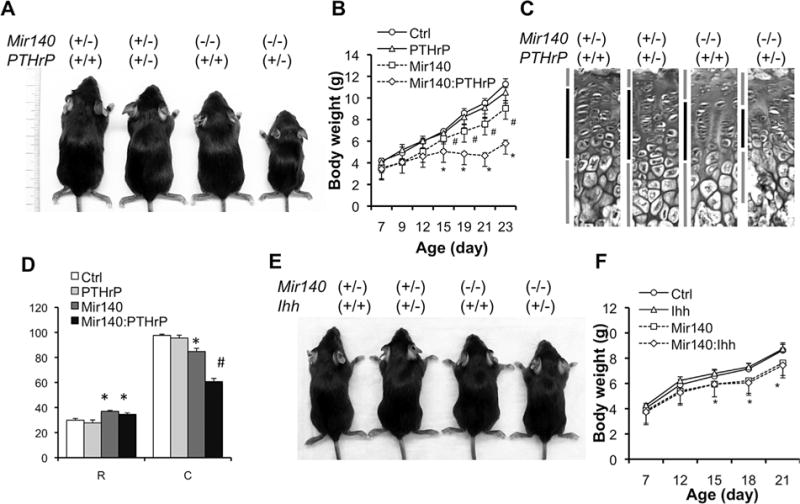
Fig. 2.

PTHrP heterozygosity exacerbates the growth defect of Mir140-null mice. (A) Pictures of 3-week-old littermates with indicated genotypes. (B) Growth curve of mice with indicated genotypes. Ctrl, Mir140+/− PTHrP+/+ (n = 6); PTHrP, Mir140+/− PTHrP+/− (n = 4); Mir140, Mir140−/− PTHrP+/+ (n = 5); Mir140:PTHrP, Mir140−/− PTHrP+/− (n = 7). #p < 0.05 versus Ctrl or PTHrP. *p < 0.05 versus Ctrl, PTHrP, or Mir140. (C) H&E-stained section of growth plates of the proximal tibia. Bars indicate the resting, columnar and hypertrophic regions. Doubly mutant mice show a significantly shorter columnar region than that of single mutants. (D) Quantification of growth plates of mice with indicated genotypes. Mice were euthanized at P23. The length of the resting zone (R) and the columnar proliferating zone (C) was measured. *p < 0.05 versus Ctrl or PTHrP; #p < 0.05 versus Ctrl, PTHrP, or Mir140; n ≥ 3. (E) Pictures of 3-week-old littermates with indicated genotypes. (F) Ihh heterozygosity has no effect on growth of Mir140-null mice. Ctrl, Mir140+/− Ihh+/+ (n = 7); Ihh, Mir140+/− Ihh+/− (n = 7); Mir140, Mir140−/− Ihh+/+ (n = 6); Mir140:Ihh, Mir140−/− Ihh+/− (n = 5). *p < 0.05 Ctrl or Ihh versus Mir140 or Mir140:Ihh.
