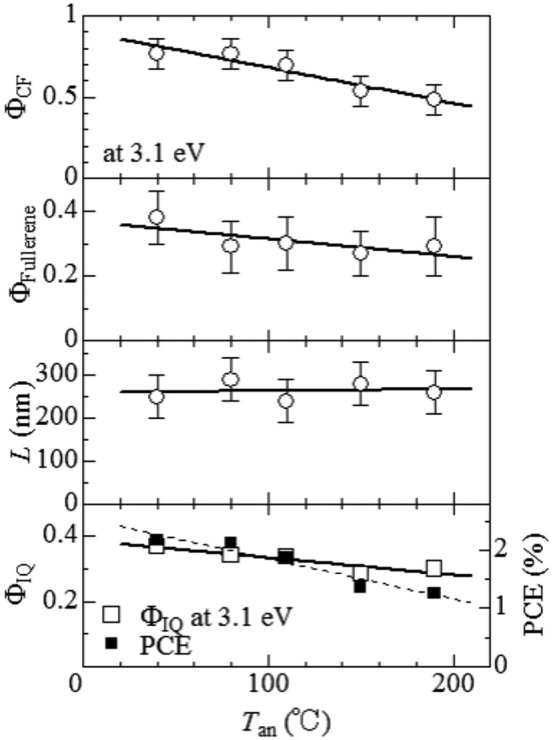
Figure 4. Interrelation among ΦCF, ΦFullerene, L, ΦIQ, and PCE in OSCs against Tan.

Solid straight lines are the results of the lease-squares fittings. Error bars of ΦIQ, and PCE are within the symbol size.

Solid straight lines are the results of the lease-squares fittings. Error bars of ΦIQ, and PCE are within the symbol size.