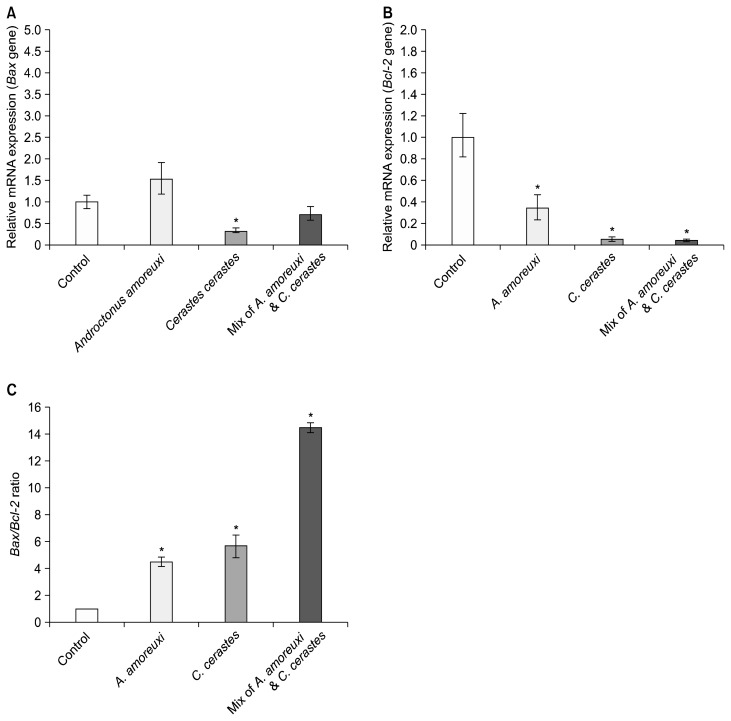
Figure 2.
The effects of the venoms studied at the IC50 values on (A) Bax gene expression, (B) Bcl-2 gene expression, and (C) Bax/Bcl-2 ratio in PC3 cells after 24 hours of treatment. Fig. 2A and 2B represent RQ (relative quantification) values – Error bars are ± RQmax, RQmin – while values of Fig. 2C represent the mean ± SD. *This mark indicates significant difference.

