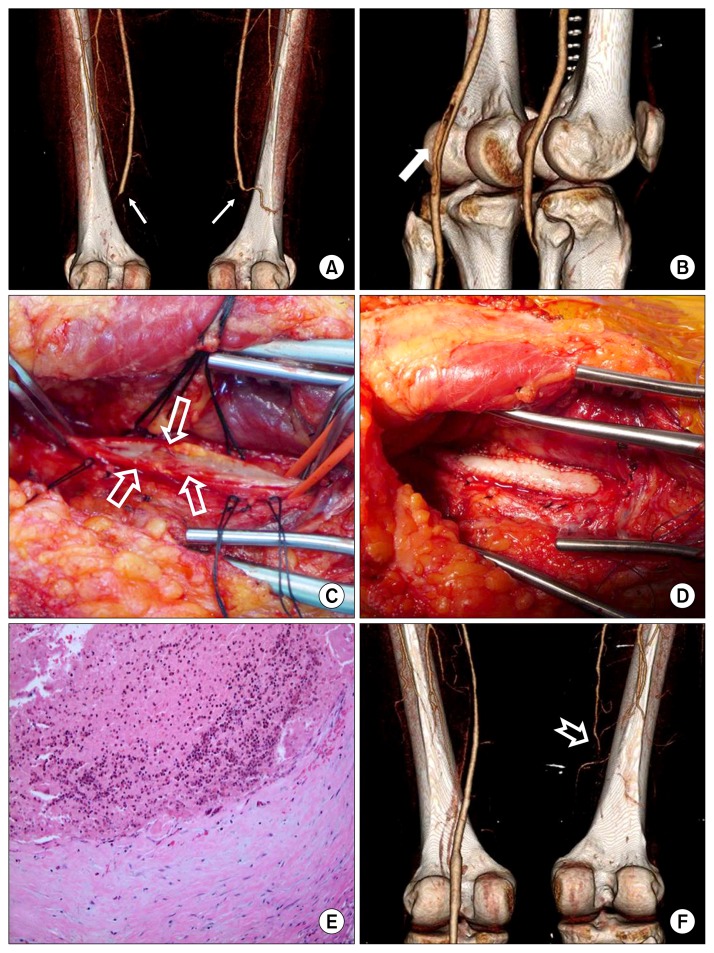
Fig. 2.
(A) A preoperative CT angiogram shows total occlusion of both PAs (line arrow). (B) CT angiogram on postoperative day 3 shows a diffuse filling defect (white arrow) in the left PA. (C) A narrowing lesion of PA (empty arrow). (D) The left PA was reconstructed using bovine pericardium (Vascu-Guard Biovascular Inc., St. Paul, MN, USA). (E) The thrombus occludes the vessel and contains a prominent number of eosinophils. The intima is thickened with a fibroblastic proliferation (H&E, ×200). (F) CT angiogram 56 days after the second operation shows the occlusion of the right superficial femoral artery and PA (notched arrow). CT, computed tomography; PA, popliteal artery.

