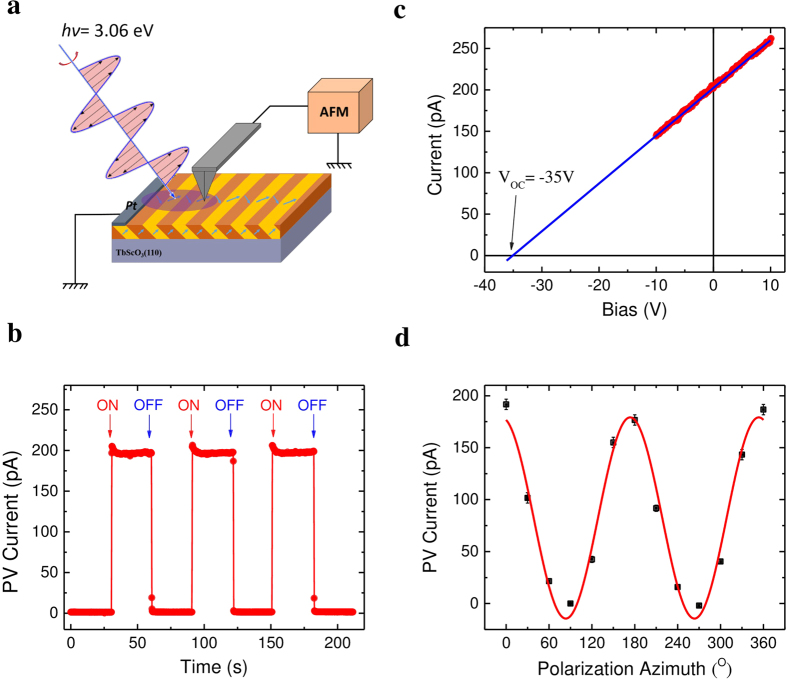
Figure 2. Local photovoltaic characterization.
(a) Schematic showing the local measurement conducted by photoelectric atomic force microscopy (PhAFM) under illumination. (b) Photovoltaic current probed by PhAFM tip. (c) Local I-V characteristics measured through the PhAFM tip. The linear exploration gives -35V as open circuit voltage. (d) Photovoltaic current collected by PhAFM tip as a function of light polarization. The continuous red line is the fitting with Equation 2.

