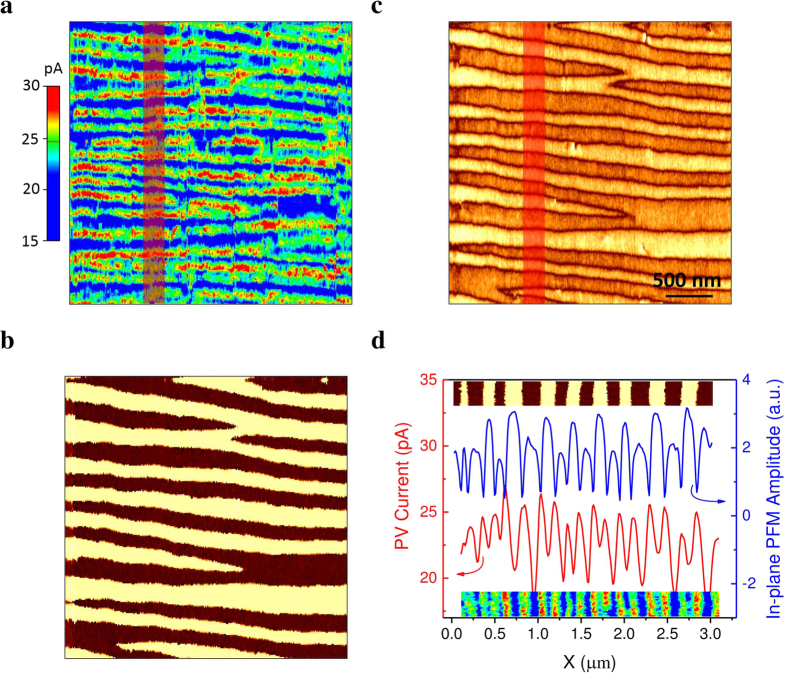
Figure 3. Spatially resolved photovoltaic current mapping with domain walls parallel to grounded electrode.
(a) Spatial distribution of the photovoltaic current detected by PhAFM. (b) and (c) are the in-plane PFM amplitude and phase signal, respectively. (d) Profile analysis of photovoltaic current distribution and in-plane PFM amplitude signal averaged over the area marked by red in (a) and (b), upper insert and lower insert show the corresponding PFM phase images and the current distribution of the analyzed region, respectively.

