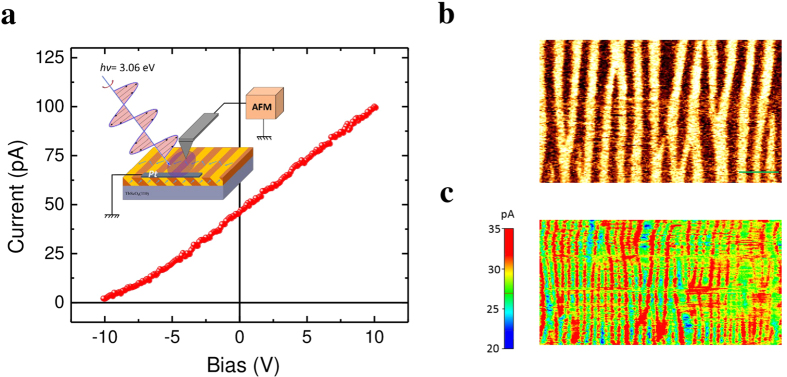
Figure 4. Spatially resolved photovoltaic current mapping with domain walls perpendicular to grounded electrode.
(a) Local I-V curve acquired by PhAFM. The insert shows the measurement geometry schematically. (b) and (c) In-plane PFM phase signal and spatially-resolved photovoltaic current distribution of the same area, respectively. The length of the scale bar is 500 nm.

