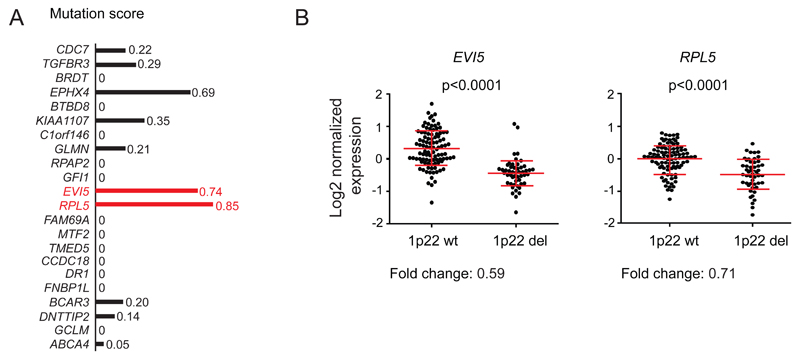
Figure 2. EVI5 and RPL5 show the highest incidence of mutations predicted to impair protein function and their expression levels correlate with 1p22 deletion status.
(A) Mutation score for all 1p22.1 genes. Mutation score per gene was calculated by taking the mutation count for each gene and by correcting this value for gene length and predicted functional impact of the mutations. The MDR identified in Figure 1B is again indicated in red. (B) Gene expression plots of EVI5 (probe set 209717_s_at) and RPL5 (200937_s_at) in 1p22 wt versus deleted cases. The red horizontal lines indicate the average value in the group and the standard deviations. p-values were calculated using a 2-tailed Mann-Whitney test. The fold change below the plot indicates the fold downregulation in 1p22 deleted cases.

