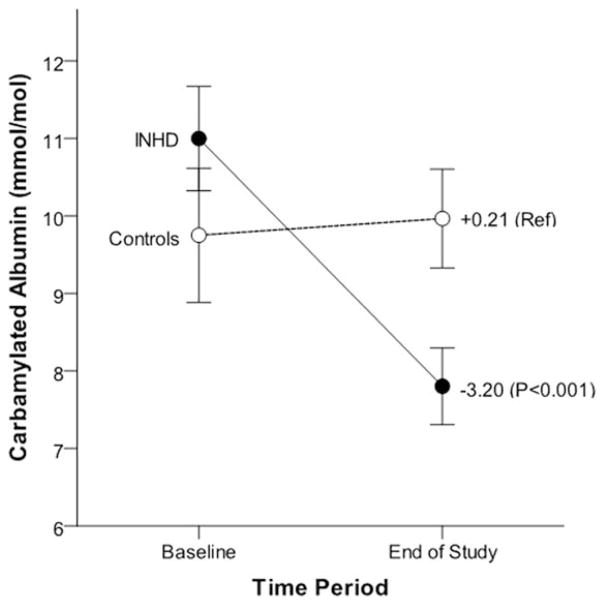
Figure 1.
Change in carbamylated albumin by treatment group. Figure shows unadjusted mean baseline and end of study (1 year) carbamylated albumin levels±stand errors in EHD patients (closed circle) and controls (open circle); mean values did not differ significantly between treatment groups at baseline (P=0.26). Values listed in figure are mean 12-month change in carbamylated albumin by treatment group and associated P value.

