
. 2017 Mar 31;96(13):e6382. doi: 10.1097/MD.0000000000006382
Copyright © 2017 the Author(s). Published by Wolters Kluwer Health, Inc.
This is an open access article distributed under the terms of the Creative Commons Attribution-Non Commercial License 4.0 (CCBY-NC), where it is permissible to download, share, remix, transform, and buildup the work provided it is properly cited. The work cannot be used commercially without permission from the journal. http://creativecommons.org/licenses/by-nc/4.0
Figure 8.
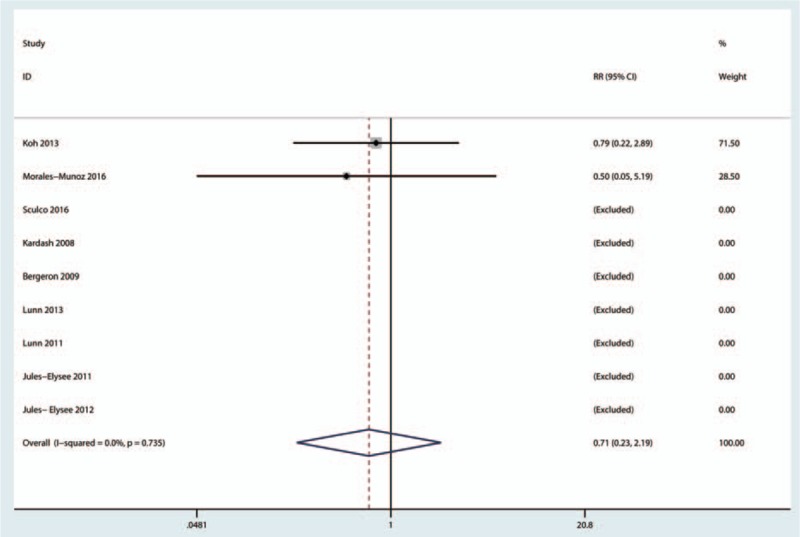
Forest plots of the included studies comparing the occurrence of infection.