
Figure 2.
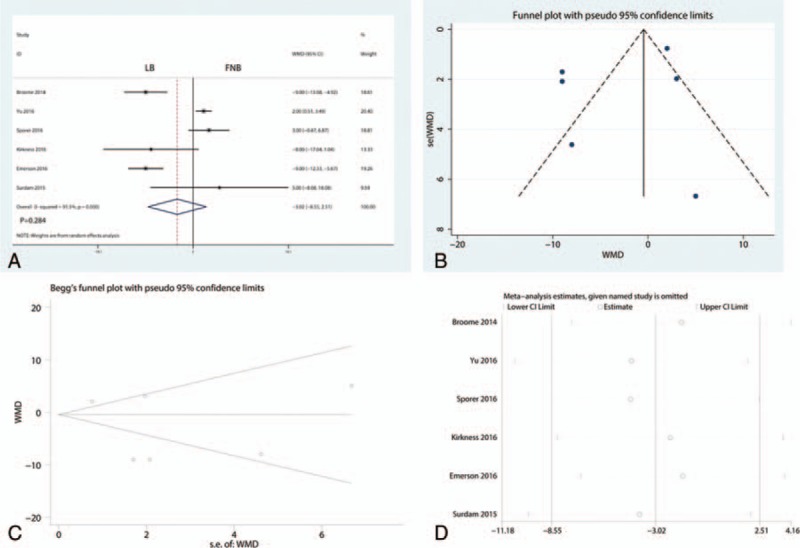
(A) Forest plot that comparing VAS at 24 hours between the 2 groups; (B) funnel plot of VAS at 24 hours; (C) Begg test for VAS at 24 hours; (D) sensitivity analysis for the VAS at 24 hours.
Official websites use .gov
A
.gov website belongs to an official
government organization in the United States.
Secure .gov websites use HTTPS
A lock (
) or https:// means you've safely
connected to the .gov website. Share sensitive
information only on official, secure websites.
(A) Forest plot that comparing VAS at 24 hours between the 2 groups; (B) funnel plot of VAS at 24 hours; (C) Begg test for VAS at 24 hours; (D) sensitivity analysis for the VAS at 24 hours.