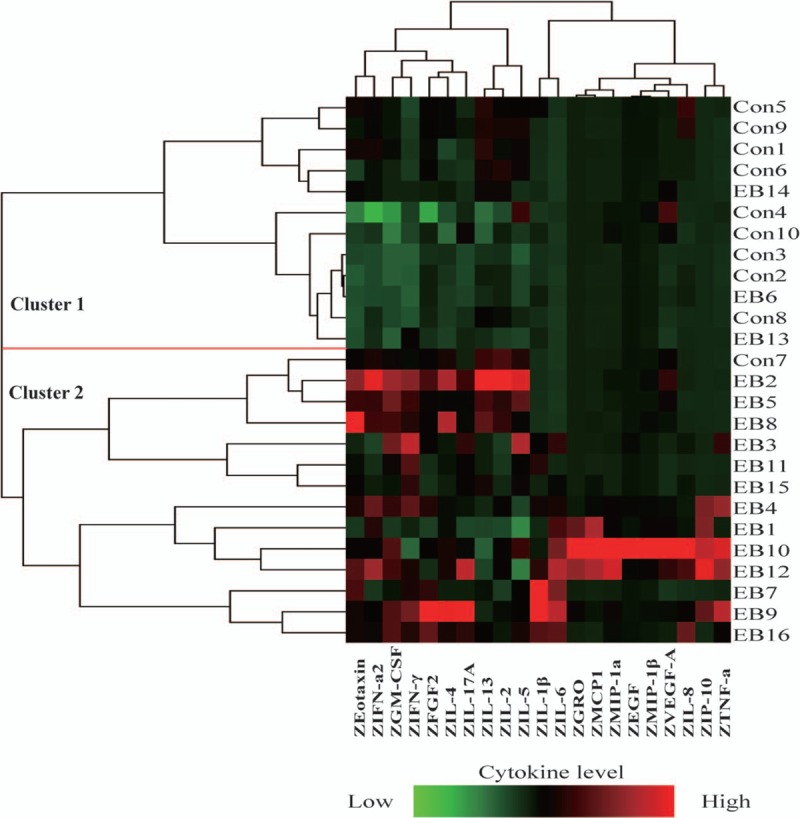
Figure 2.

Heatmap depicting hierarchical clustering of sputum cytokine profile. Twenty-one cytokine levels in 16 patients with NAEB and 10 healthy subjects were shown. Each row is an individual subject. Each column is a cytokine. Left, dendogram shows the similarity of the samples. Right, numbers are the subject numbers.
