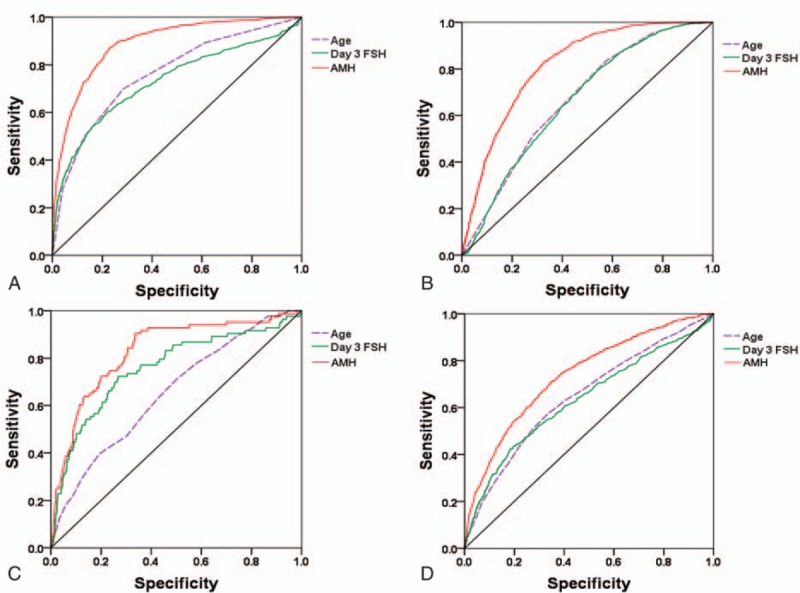
Figure 2.

Receiver operating characteristic curves for prediction of ovarian response. (A) Low response (≤3 oocytes, AUC = 0.89). (B) High response (≥15 oocytes, AUC = 0.82). (C) Cycle cancellation (AUC = 0.83). (D) No embryo available (AUC = 0.74). AUC = area under the curve.
