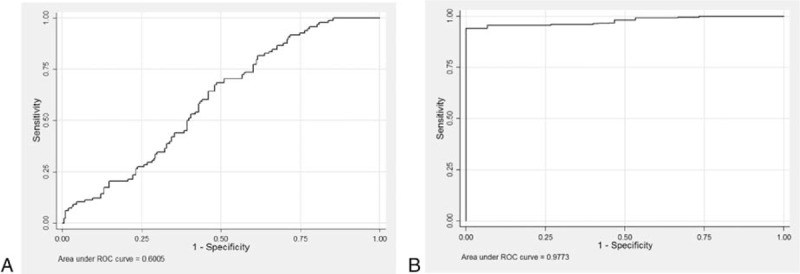
Figure 2.

(A) Receiver-operating characteristic (ROC) curve of baseline quantitative hepatitis B surface antigen (qHBsAg) levels for predicting inactive carriers. The area under the ROC curve was 0.60 (95% confidence interval [CI], 0.54–0.67) when qHBsAg level was <1000 IU/mL. (B) ROC curve of baseline qHBsAg levels for hepatitis B surface antigen seroclearance. The area under the ROC curve was 0.97 (95% CI, 0.96–0.99) when qHBsAg level <50 IU/mL.
