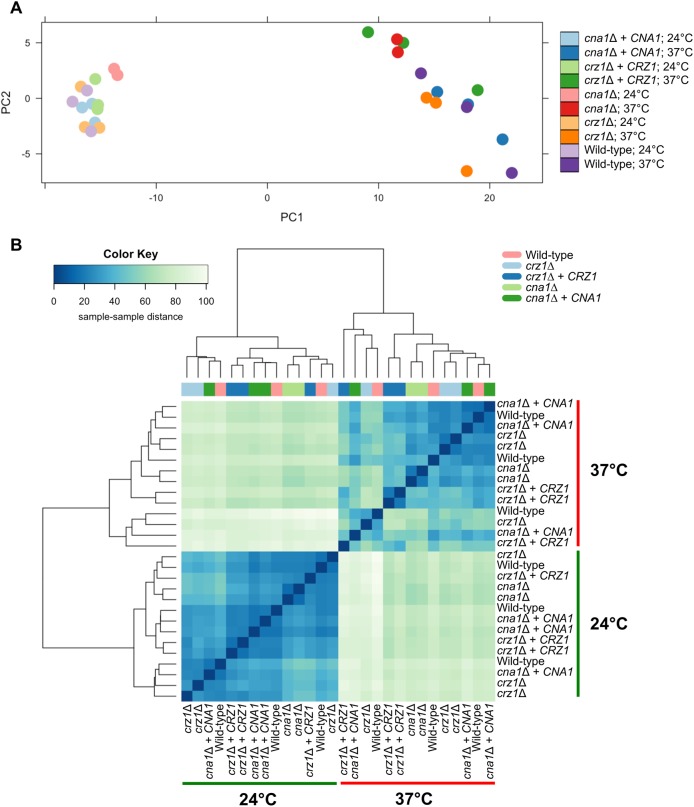
Fig 3. Expression dynamics of calcineurin and Crz1 target genes.
(A) Principal component analysis (PCA) was performed to compare gene expression levels of the WT (H99), cna1Δ (KK1), cna1Δ + CNA1 (KK5), crz1Δ (AFA3-3), and crz1Δ+ CRZ1 (AFA3-3-17) strains grown at 24°C and 37°C. Lighter colors indicate the 24°C samples and the bright colors indicate the 37°C samples. Note that results for one cna1Δ 37°C biological replicate were not included in the analysis, due to sample contamination. (B) Hierarchical cluster analysis recapitulates the observation from the PCA. The heatmap indicates the pairwise distance between samples. The x-axis of the color key indicates the distances between the samples, with the darker blue signifying a higher similarity (i.e. small distance) between the samples, while the lighter blue signifies a lower similarity (i.e larger distance) between the samples. The color bar above the heatmap indicates the sample type. Gene expression levels at 24°C were different from the gene expression levels at 37°C. In general, gene expression of samples grown at 24°C showed less variability (dark blue). However, gene expression of samples grown at 37°C showed more variability (light blue).

